The miniDSP nanoAVR – a case study
I’ve always been more of a two-channel audio enthusiast than a home theater enthusiast. While I and my wife very much enjoy watching movies together in our modest home theater system, the idea of spending a lot of money on it or a lot of time optimizing it has never been particularly appealing. To put it another way, I get my share of unease already with two-channel and want to keep the HT purely fun!
Even so, over the last few years as I’ve delved into active speakers and the capabilities of DSP in audio systems, I’ve wondered if there were a way to incorporate some of that into my HT system, at a reasonable cost. miniDSP offers a unit called the 10×10 HD that allows one to equalize a multi-channel setup, but it can’t be used with inexpensive A/V receivers that have no external analog path. And there are computer-based systems such as Bodzio ultimate equalizer that offer to equalize all channels and perform active crossovers on every speaker, but this is quite a complex setup.
Enter the miniDSP nanoAVR. In terms of I/O switching, it’s very straightforward: just HDMI in (two of them) and HDMI out (one). And the eponymous DSP in between, running at 96 kHz. It allows you to do equalization on the eight HDMI audio channels, with mixing and routing of the input channels to the output channels. I decided to use my own HT system as a case study in deploying the nanoAVR.
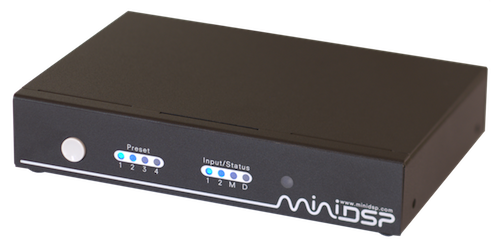
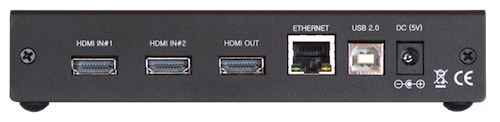
What it is
A tiny little box, about 25 mm high, 140 mm wide, and 100 mm front to back. Two HDMI inputs, one HDMI output, a socket for power, and USB and Ethernet sockets for computer control (not for audio).
Put almost any sample rate in, and the nanoAVR resamples it to 96 kHz, applies the processing that you specify, and then outputs the 96 kHz audio along with the video over the HDMI pipe again. In order to make this work, you need to set your source (e.g. Blu-ray player) to output audio over HDMI in linear PCM. That is, eight channels of uncompressed audio – the nanoAVR won’t accept proprietary compressed formats like Dolby Digital and DTS.
Software installation is straightforward. The “plugin” comes in Mac and PC versions, so I used the Mac version. On starting up the plugin, the obvious first impression is that miniDSP have done a refresh to their user interface, with a new, more streamlined look.
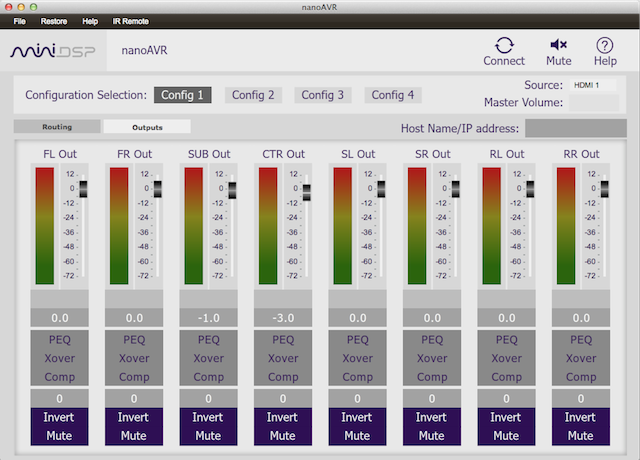
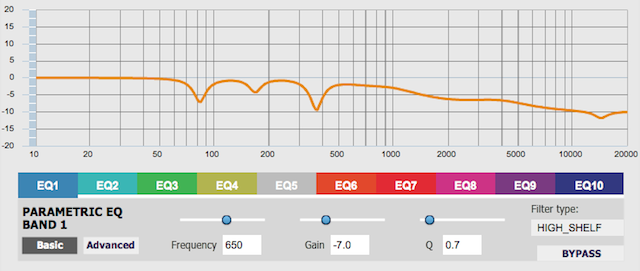
The controls, though, will be familiar to anyone who has used one of their other products, like the 2×8 board that I wrote about some time ago. One difference is that there’s no tab for input controls – EQ can be applied only on each output channel. On the upside, the number of EQ bands on each output channel has been increased to ten, which should be enough for almost any application:
A little theory
There are basically two ways of measuring the acoustic output of a loudspeaker. This diagram illustrates:
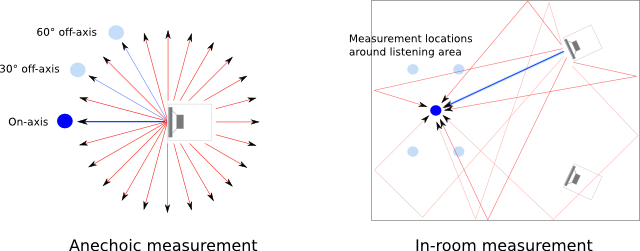
On the left, we are measuring only the output from the speaker, with no reflections from the room. I’ll refer to this as an anechoic measurement. One way to do this is to perform measurements in an anechoic chamber – a large and rather expensive room designed in such a way that there are very few reflections from walls or other surfaces in the room. More accessible techniques are used to get an approximation of this type of measurement: measuring outdoors; using a gated measurement that “cuts off” after a short time so as to exclude reflections; and ground-plane measurements.
On the right, we are measuring the result of placing the loudspeaker in a room. The microphone (indicated as the blue dot) will see the direct acoustic signal from the speaker, then reflections from the walls, reflections of reflections from the walls, and so on. Add the ceiling and floor to the mix, and the picture becomes very complicated very quickly. This measurement, which I’ll refer to as the in-room measurement, can look quite different to the anechoic measurement.
In both cases, additional microphone locations are shown (in lighter blue). In the case of the anechoic measurement, the location of the microphone with respect to the speaker (in 3D space) will change the measurement. While the common measurement is “on-axis”, various angles with respect to the (nominal) axis are used to assess the acoustic performance of a loudspeaker. In the case of the in-room measurement, the position of the microphone within the room can significantly affect the measured response.
Which type of measurement you use depends on what you are trying to accomplish. If you are designing a loudspeaker, you must use anechoic measurements (or try and approximate them). Typically, a flat on-axis (magnitude) response is considered desirable, and (less commonly) a smoothly-varying set of off-axis response curves is also considered desirable – see my article on the Mini Convertible for an exploration into that topic.
If, however, you are trying to optimize a subwoofer in your room, then you must perform an in-room measurement. The response will vary significantly as you move the microphone location. (It will also vary a lot if you leave the microphone where it is and move the sub.) In addition to a simple magnitude response, plots such as decay and spectrogram plots can help illustrate how the subwoofer is behaving in your room. Full-range (i.e. 20 Hz to 20 kHz) in-room measurements are used less commonly (in home enthusiast situations), but a smoothed full-range magnitude response will show the general trend in the sound energy with frequency in your room. Another simple but useful metric for understanding the room’s acoustic behavior is the reverberation time.
Speaker measurements and equalization
Most people inserting a nanoAVR into their HDMI chain are likely to assume that their speakers are well-designed and do not need to be measured independently of the room. Still, some may be in the process of building or modifying their HT speakers, so let me take a few paragraphs to appeal to that group.
My five HT speakers are all small-ish boxes each containing a Jordan JX92s full-range driver, to which I’ve recently added tweeters (Bohlender-Graebener Neo3 PDR). Given the expense and complexity in going fully active for a full suite of HT speakers, I’ve been playing around with passive crossovers for them using parts I have on hand. One thing that strikes me is that the way that baffle-step compensation (BSC) is done – with an inductor and a power-absorbing resistor – is very clunky and awkward.
I decided to use this case study to trial an idea I’ve been thinking about lately, which is that of hybrid active-passive crossovers. Basically, the idea of the hybrid active-passive crossover is to use passive components only for the purpose of splitting the signal, but not to do baffle-step compensation or any other EQ or response shaping. Then, use the active part of the system to perform the necessary baffle-step compensation and other response shaping.
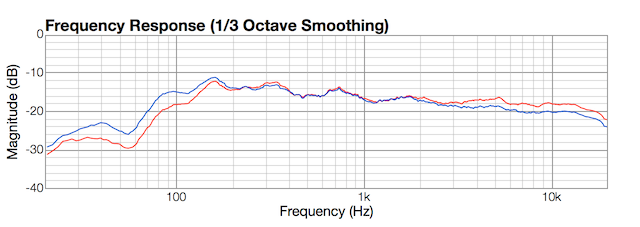
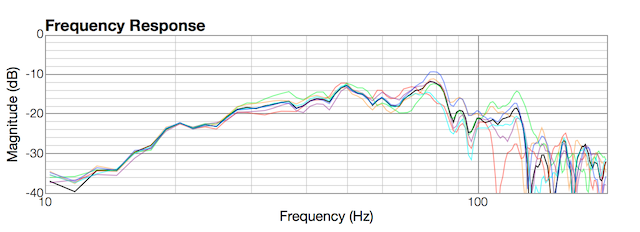
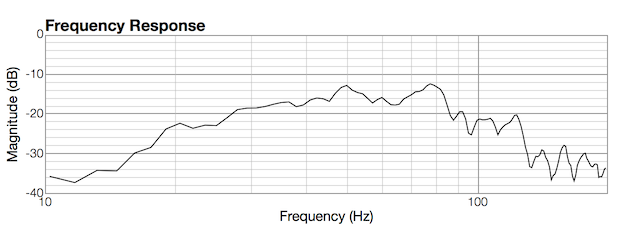
The graph below shows the response with only the passive crossover in red (a quasi-anechoic measurement, taken outside, on axis at 1 m, elevated and with a 5 ms gate), and in blue the response with DSP EQ applied using the nanoAVR. The individual responses of the woofer and tweeter are shown in orange and green. I’d say it works pretty well, despite the crossover being whipped up using leftover parts.
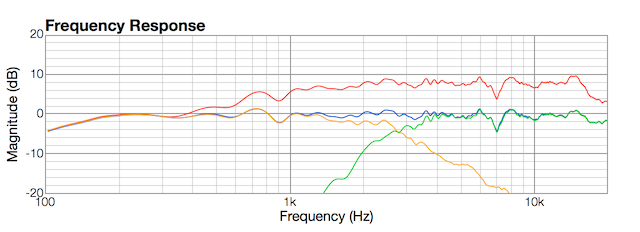
A note on graph scale: the vertical axis is a relative measurement, not an absolute SPL measurement. As a general rule, these measurements are performed at an SPL of around 75-80 dB.
In-room measurements and equalization
I then went through the process of taking in-room measurements and applying equalization and bass management, basically following the procedure in the miniDSP app notes. For the acoustic measurements, I used FuzzMeasure Pro, my CSL-calibrated EMM-6, and my MOTU Microbook II. I pointed the microphone at the ceiling and used the 90-degree calibration file so I wouldn’t have to move the microphone to measure different speakers around the room (see Appendix A: A note on microphone orientation).
Subwoofer
Subwoofers are at once the greatest and potentially most mysterious component in any audio system. I sold the first subwoofer that I purchased many years ago in dismay. Since then, I’ve realized that you simply won’t get very far unless you a) measure what the sub is doing in your room, and b) move the sub to where it performs best. Then you EQ it.
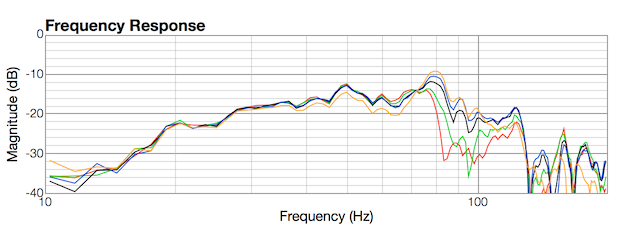
For example, the graph below shows several locations of my HT sub, a dual opposed 10″ sealed DIY unit. In red is the response in what I thought was a good location, with the drivers oriented facing along the wall. Then in green, black, and blue are measurements obtained with the sub moved progressively to the right in increments of about 20 cm (8″). In orange is the response with the sub then rotated so the drivers face towards me and the wall. I chose the “black” location.
The subwoofer location is only part of the story, though. The measured response will also vary depending on where in the room you measure. The following graph shows the measured response with the microphone in the center of the listening area in black, and several other curves in color with the microphone moved in a constellation of positions: 50 cm left and right, 40 cm forward and back, and 20 cm up and down.

It’s not uncommon to suggest equalizing against the average response of several locations. As it turns out, the average of these seven positions is not far off the response in the central position, at least in this example. That is quite a handy thing to know, as it’s certainly much more convenient to only do one measurement to verify each EQ change, instead of seven. See Appendix B: A note on multiple measurements – subwoofer.
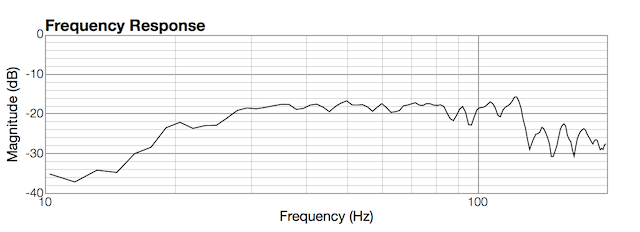
Here is the average response of all seven measurement locations after applying EQ:
Equalizing the speakers
Now to measure and equalize the five speakers, starting with the front left and right. If you’re used to thinking of parametric EQ as peaking filters, it’s time to become friends with the shelving filter, because these are invaluable for response shaping in situations like this. For the front speakers, I applied two shelving filters: one to “tilt” the response down a little at the high end, and the other to bring up the low end to compensate for the 80-130 Hz suckout that’s still evident. This graph shows the original in-room response in red, and the adjusted response in blue:
Does the response of the speakers vary with position as well? Yes, it does, but the general characteristics of the measured responses are fairly consistent, at least over the relatively small measurement area I’ve used in this example. See Appendix C: A note on multiple measurements – speakers.
I then equalized the surround and center speakers to have a similar curve to the front left and right. Remember, though: with in-room measurements, you are measuring a combination of the direct sound and reflected sound, and the relative ratio of these may be different (due to speaker design and placement) for these channels than the front left and right speakers. So expect to make further adjustments based on subsequent listening.
In my HT, the surrounds are free-standing although close to the walls and other obstructions like a side table. While the measurements are not as smooth in the midrange as the front left and right speakers, I gave them only a little shelving in the treble to make the overall curves match well enough.
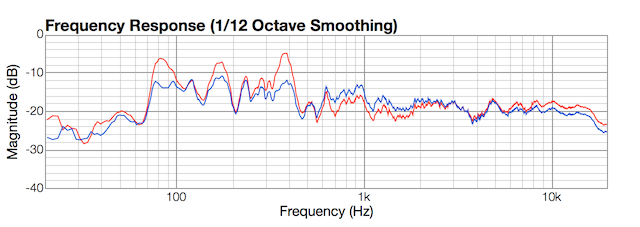
The center speaker, however, was a different story, with a response curve that could only be described as horrible. The center speaker is located underneath the TV, in a sort of “hollow” formed by the supporting bench and the floor underneath it. I suspect that most center channel speakers suffer a similar caged fate. In my system, this unfortunate placement causes substantial resonant peaks. Reducing the amount of smoothing from 1/3rd octave to 1/12th octave helps to see what’s going on – the center channel response without additional EQ is shown below in red. I decided that I may as well just apply brute-force EQ in this case and see how it worked out (shown in blue):
Bass management
[Update 27th July 2014. miniDSP have just announced a new beta version of their plugin that has a separate screen for bass management. I spent the time to copy my settings over to the new plugin and change the routing to work with this plugin. This section has therefore been completely revised.]
The nanoAVR has a new feature: a dedicated screen for bass management. This turns out to be fairly simple to use, following the procedure in the miniDSP bass management app note. I was able to get a reasonably good combined response on all five channels by:
- Setting up a “textbook” crossover on the sub and mains, with a 24 dB/octave low pass Linkwitz-Riley filter at 80 Hz on the subwoofer and a 12 dB/octave Butterworth high pass filter at 80 Hz on the mains.
- Adding delays to the speaker channels to get the best response on the front left and right channels.
- Repeat the above for the center channel, and then the surround channels.
If you’re having trouble getting good integration between a speaker and the subwoofer, remember that since the order (slope) of a crossover filter affects the phase shift through the crossover region, the change in the combined response with different filter slopes is much more dramatic than you would get from the change in slope (amplitude) alone. A simple strategy I found worked to find the best possible response is to switch to a Butterworth filter and change the slope from 24 dB/octave up to 48 dB/octave, measuring at each slope (24, 30, 36, 42, 48).
Listening and tweaking
I then spent some time listening to the system. Since the nanoAVR has four presets that you can click between with a remote, it’s easy enough to load different EQ settings into different presets for quick comparison auditioning. Here are the adjustments I’ve made so far:
- Adjust the overall “tilt” slightly to give a little added treble all around
- Increase the LFE channel level by 2 dB to give explosions and low-frequency effects a little more… effect.
- Reduce the level of the center channel into the subwoofer to reduce some “bassiness” on dialog.
- Add a broad peak to the center channel at 4 kHz to give dialog a little extra clarity and “bite”.
After a few weeks with the new system, here’s the response of all 5.1 channels of my HT system, measured at the central position: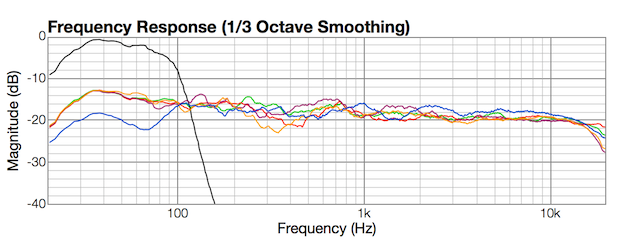
You can see that all speaker channels are fairly consistent, with a gentle slope down from bass to treble of a few dB. The center channel in blue has a rolled-off low bass and a broad lift evident from around 2 to 9 kHz, as mentioned above. The midrange is a bit bumpy for the surrounds in particular, but I didn’t think equalizing them any further would yield a benefit.
Concluding remarks
I’m finding that, even with my relatively modest HT system, getting a consistent frequency response across all five speakers is a bit of a revelation. I don’t hear a surround mix playing as separate speakers around me as I did before – instead, I feel like I’m in the middle of things. I surmise that removing the power-sucking baffle-step compensation circuits from the loudspeakers has helped my inexpensive AVR along a bit too, but I really couldn’t say by how much.
It is a fair amount of work to set up the nanoAVR properly. I guess that’s the tradeoff with a manual versus an automatic system. The advantage of the manual system is that you get full control and can adjust and refine your settings incrementally as you listen to the system.
There are some limitations to the nanoAVR. There are only two HDMI inputs, so if you have more HDMI sources, you will not be able to run them all through the nanoAVR without deploying an external HDMI switch. Although the original nanoAVR plugin had some limitations in the frequencies you could use for your bass management crossovers, the new version (as of 26 July 2014) allows completely flexibility in this regard – you can fine-tune every single channel in slope and frequency for both the lowpass and high pass filters.
In summary, I think this is a very neat little unit. Since it does a full 8 channels of EQ at 96 kHz, high-res audio content such as Pure Audio Blu-ray discs can benefit from it as well as movies. And all that at half the price of miniDSP’s mostly-equivalent analog I/O unit (the 10×10 HD).
Acknowledgments
This article was improved greatly with comments and suggestions from Chris McKeague, Wayne A. Pflughaupt, and Dave Moore.
HifiZine gratefully acknowledges the support of SuperMegaUltraGroovy for the use of their excellent FuzzMeasure Pro 3 measurement program.
Appendix A: A note on microphone orientation
For the in-room measurements, I used a 90-degree orientation for the microphone – that is, with the microphone pointed at the ceiling – and the 90-degree calibration file for the microphone as supplied by Cross-Spectrum Labs.
A potential issue with this is that an in-room measurement is not a free-field measurement – a measurement where there is a single source of sound. In addition to the initial direct sound from the speaker, there are numerous reflections from all angles. But measurement microphones are not truly omnidirectional, and at high frequencies are more sensitive to the front than to the sides. (See my review of the CSL-calibrated EMM-6.) So:
- If the microphone is pointed at the speaker being measured and a 0-degree calibration file used, then the reflections from the floor and ceiling will be de-emphasized slightly relative to the direct signal from the speaker.
- If the microphone is pointed to the ceiling and a 90-degree calibration file used, then reflections from the ceiling will be emphasized slightly (and those from the floor de-emphasized slightly).
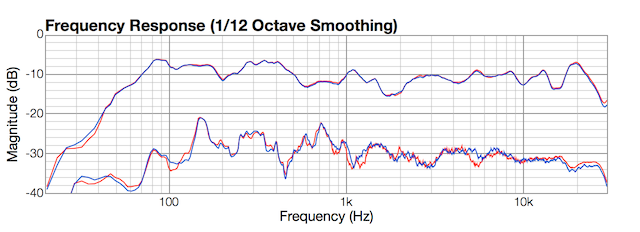
If you have 0-degree and 90-degree calibration files, you can test the significance of mic orientation for yourself in your own room. (When doing so, don’t simply rotate the mic, make sure that the tip is in the same position for each orientation.) In the graph below, the top pair of plots show the measurement of a fullrange driver from a distance of 20 cm, with the mic pointed towards the driver and pointed sideways. (The appropriate calibration file was used for each measurement.). This shows that the two calibration files are consistent with each other. In the lower pair of graphs are in-room measurements of the front left speaker, with the 0-degree orientation in red and the 90-degree orientation in blue. In this room, there is a difference between the two measurements but it is not large enough to affect the equalization process.
Appendix B: A note on multiple measurements – subwoofer
One of the things I wanted to understand better in this exercise is the admonition against “equalizing for a single point in space”. I agree entirely, but it sure is a lot more convenient to run one measurement than a half dozen or more each time you make an EQ change. I tested this with a “constellation” of measurements, where I measured a speaker firstly in the nominal centre of the listening area, then again with the microphone moved 50 cm left and right, 40 cm forward and back, and 20 cm up and down, to see how much the response varied. To illustrate, here’s this set of measurements for the subwoofer:
Here is the average of this set of seven measurements:
As you can see, the average is very similar to the central location, if you imagine slightly more smoothing applied to it.
Note: There is a potential problem with performing EQ based on averaging: if any of the measurements has a null, then it will throw off the average and thus your EQ. The use of smoothing reduces this issue; alternatively, simply avoid using any measurement location that has a deep null.
Appendix C: A note on multiple measurements – speakers
When running a full-range in-room measurement, the response can vary with small changes to microphone position. But does that mean that we need to simply throw up our hands and give up? No, not at all. Here is a constellation of nine measurements of the front left speaker; in black, the central location, and then in lighter colors: 50 cm left and right, 90 cm left and right, 40 cm forward and back, and 20 cm up and down:
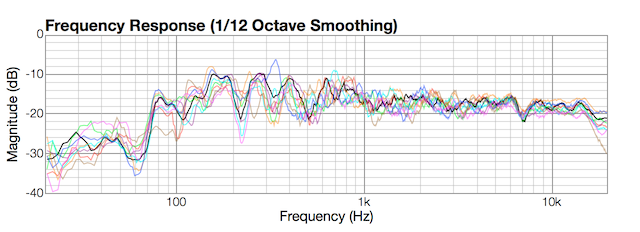
Here is the average of this set of nine measurements:
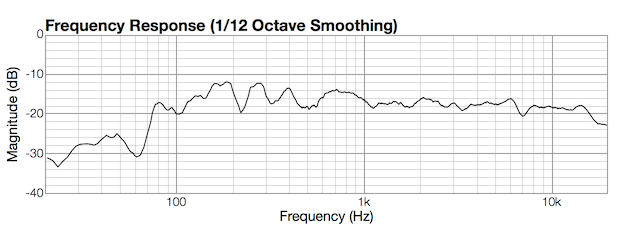
Comparing these two graphs, it can be seen that the general characteristics of the magnitude response are fairly consistent across the different locations. Also, the average of the measurements is quite similar to the central location, if you imagined a little more smoothing applied. This suggests that performing EQ based on the measurement at the central location is not going to lead you far astray as long as:
- some smoothing is applied to the measurements, and
- you aren’t trying to iron out every wrinkle in the graph, just get the overall response smooth.


Thanks for your excellent review / case study of the NanoAVR being put into service – gives a good sense of its capabilities and the calibration effort and rewards.
A couple of questions if you don’t mind:
(1) I presume there’s no reason one couldn’t use the unused 7th & 8th channels to bi-amp ones main speakers, using the Nano’s crossover functionality to ultimately (after D/A conversion) send high & low-passed line-level signals for the mains speakers’ treble and bass drivers, respectively, to the amplifier? (in the simple scenario I’m thinking of I’d leave the speakers crossovers in place, but just have the benefits of a narrower/easier frequency band for each amplifier)
(2) I seem to recall reading that the way the NanoAVR’s low-pass filter applies to the sub will mean any LFE info above that frequency (e.g. 80-120hz) won’t be passed to the sub so wouldn’t be reproduced by any channel in the system. Did you observe this in practice?
Hi Jake, thank you for commenting. I’ll take the first question in two parts…
1a. While I haven’t tried it, there’s no reason I can think of why you could not use channels 7 and 8 as either tweeter or woofer channels for the main speakers, if you run a 5.1 system.
1b. While it is possible to leave the existing crossover in place when you do this, you must remember that anything you do in the active crossover “adds” to what the passive crossover does. So at a minimum you are introducing an additional 3dB of attenuation to both the woofer and the tweeter at the crossover point. You could counter this by moving the filter frequencies away from the nominal crossover frequency (down for highpass, up for lowpass), but it fairly soon becomes a question of why bother… 😉 If it were me, I would remove or bypass the passive crossover, leaving only a protection capacitor on the tweeter.
2. [Edit 27 July 2014] I’ve not observed it as an issue in practice, with an 80-100 Hz crossover frequency. However, the new version of the plugin has a dedicated bass management screen that removes the issue completely.
Hope this helps 🙂