Bass Integration Guide – Part 1
Introduction
Exceptional bass is nearly always the exception in high-end audio. You can buy great midrange, but truly accurate bass reproduction requires a room-specific solution. The investment and effort involved is considerable and that is why exceptional bass is so rare.
This article is the first of a three-part series. The aim in part one is to establish the need for the strategies that are covered in parts two and three. Part two covers acoustic treatment. Part three completes the integration process with speaker placement, phase alignment and EQ.
Completing part one will help you to understand your current level of bass performance. Parts two and three will then transform the bass performance. Complete every step in this guide and the result is expected to rival the best bass you have ever heard.
Throughout this article you will find links to my blog, which expands on particular points.
Why accurate bass is difficult
Achieving accurate bass reproduction in a domestic room is difficult because the room itself dominates the sound. Even a good room has many problems that require attention. We can easily identify a poor sounding room at higher frequencies, but in the bass range we are unable to make that distinction due to the limits of our auditory processing. As a result, we may blame the subwoofer for poor sound when in fact it is the room itself that is the problem.
The primary problem is room modes, with their associated frequency and time domain aberrations. In-room measurements reveal large swings in response that can be as much as +/- 20 dB. Some frequencies will decay at a much slower rate. This is referred to as modal ringing.
Whether you have a good or bad room, the same strategies are required.
Why you can’t trust your ears
A common view among audiophiles is that you can get accurate bass by tuning by ear, without using measurements. Once the nature of room-related acoustic problems are understood, the limitations of this approach become clear. While our ears are the final judge of sound quality, they are highly ineffective when it comes to the kind of specific data that is required to achieve our outcome. Our ears may tell us that there are bass problems, but we then need to use measurements to find and solve those problems. Once that is done, you can then evaluate the result subjectively.
What’s in this guide
The complete Bass Integration Guide outlines a 5-step process to getting great bass:
- Start with at least one high quality sub.
- Measure the existing bass performance of your room.
- Install acoustic treatment.
- Determine speaker/sub placement and the need for more subs.
- Apply EQ and complete integration.
In this first part, steps one and two are covered. While I’m tempted to try to convince you that both bass traps and EQ are essential, this guide is about finding out for yourself. By taking measurements of your own room, you can determine for yourself what you need.
Performance targets
This guide will show you how to meet certain performance targets. I have developed these targets after many years of experimentation, measurement and evaluation.
- Bass extension: Adequate low-frequency extension for your typical source material (this could range from 14 to 40 Hz).
- Headroom: At least 3 dB headroom at your maximum desired output level at all frequencies. This means cone excursion should not exceed 70% of the driver Xmax.
- Target curve: The combined system bass response including all subwoofers and the mains should match the target curve shown in Figure 1 below. The curve is determined by three variables that need to be chosen based on user preferences. The curve shown is just one possibility, but there are many variations where each variable is adjusted within the ranges shown. The midrange level rises at F1 until it reaches F2, below which the curve is flat until the low frequency roll off point. The boost amplitude and both knee points (F1 and F2) are to be chosen from the ranges shown in Figure 1.
- Frequency response: Flat response in every significant seat +/- 3 dB relative to the chosen target curve with third octave smoothing applied.
- Spectral decay: Decay rate of 20 dB in the first 150 ms from 40 – 300 Hz. (Note: The time window setting for any waterfall or decay plot used to determine this must be set to 300 ms.)
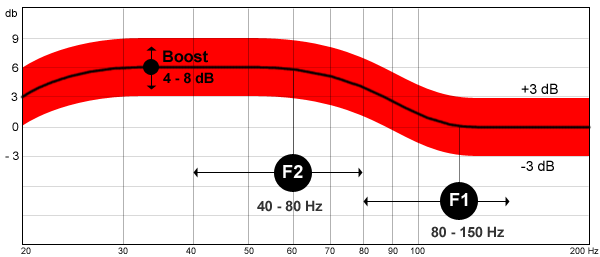
Figure 1. Target curve where the bass response is shelved up by 6 dB
The target curve is flexible to allow for different user preferences. You should determine a target curve that works in your system, factoring in the level at which you typically listen and typical source material. Some would dispute the validity of using a target curve. Common concerns are addressed on my blog:
It should be noted that not every curve possible within the suggested ranges will work. For example, if you were to add 8 dB of boost and start shelving up at 150 Hz (F1) to a knee at 80 Hz (F2), there would be too much lower midrange resulting in a muddy sound.
Measurement tools
You will need a calibrated measurement microphone along with a suitable preamp and stand. The cost of these items is around AUD $250 and the software is both free and easy to use.
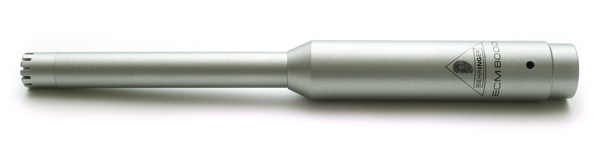
Figure 2. Behringer ECM8000 electret measurement microphone
Dayton EMM-6 is the recommended mic. It is almost identical to the Behringer mic shown above, but it’s cheaper and has better unit to unit consistency. Either mic can be purchased pre-calibrated directly from Cross Spectrum labs (Dayton EMM-6, Behringer ECM8000). You can also get an existing mic calibrated. Pre-calibrated mics are supplied with a calibration file that is unique to each mic. Purchased elsewhere, both mics come with a generic calibration file, but they can be out by as much as 10 dB.
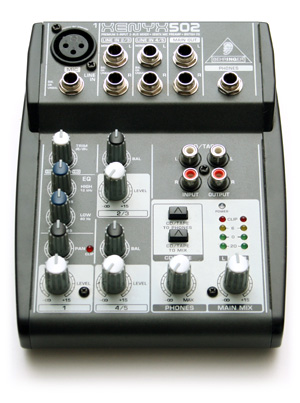
Figure 3. Behringer Xenyx 502 mini-mixer with mic preamp and phantom power
This mic requires a preamp that provides phantom power. A popular choice is a Behringer mixer such as the Xenyx 502, an inexpensive unit. USB options are also popular, but they can suffer from compatibility issues. Units with an analogue output don’t have this problem, and the Behringer mixer is a cheaper option. EQ is included as well and can’t be defeated, so the controls should be set to their central position. Regardless of the choice of preamp, any deviations from a flat response can be compensated for in the calibration process when setting up the software.
Introducing the Room EQ Wizard
Room EQ Wizard (REW), is the program that we will use in this guide. It is very powerful and easy to use. Thanks to the generosity of its creator, it is also free. Here are some useful links to help you get started with REW:
- Download from Home Theater Shack
- Initial setup Instructions on my blog
- Check the online help files
- Visit the REW forum for more help
Step 1. Start with a high quality sub and mains with decent bass capability
You will need at least one high quality sub, and mains that have decent bass capability extending below your intended sub crossover point. A sub is required for independent placement flexibility and level control – mains should be placed with a primary focus on achieving the best imaging and this will often dictate a position that does not perform well in the bass range. Subs also allow the ability to set the level independently without overloading the mains.
You may need to add a further two subs to smooth out the room response, but whether this is required will be determined later.
At low frequencies, all of the subs will add to the output. Above approximately 40 Hz, they will tend to smooth out the room response without adding significantly more output than a single sub. You may choose to have one larger subwoofer placed for maximum extension and room gain with smaller subwoofers placed for maximum smoothness. Alternatively you may choose multiple identical subwoofers.
Consider your output demands
Estimating your output requirements and how they can be met can prove to be a challenge. The first challenge is choosing a suitable target. After completing the integration process and room problems have been tamed, you may choose a higher than expected bass level, one that would previously have sounded boomy.
The second challenge is that simulations are often inaccurate in estimating both room modes and room gain. That introduces a great deal of uncertainty.
Overlapping mains and subs
The conventional approach is to cross the mains over to a sub in the 80 – 120 Hz region. For example, bass content is filtered from the mains with a high pass filter when they are set to “small” in your AV receiver settings.
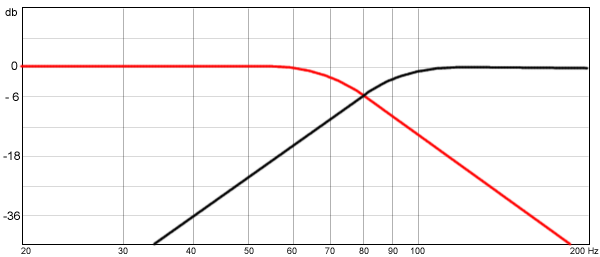
Figure 4. Conventional 24 dB per octave crossover – the response of each driver is 6db down at 80 Hz
The approach recommended in part two of this series loads the room from multiple positions. Each position is carefully chosen so that when all bass sources are combined, the result is smoother than any of the individual speakers. Often it is beneficial to allow the mains and subs to overlap. That way, the mains and a single sub load the room from three positions. In the ideal three-sub setup you will have five bass sources.
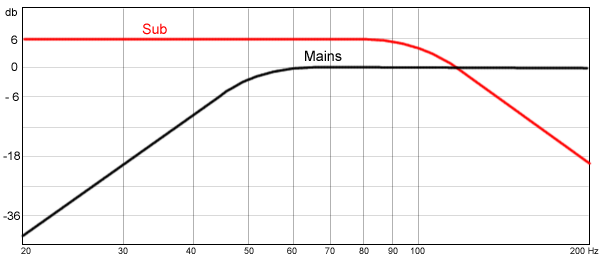
Figure 5. The suggested crossover approach where the mains and sub overlap and the sub has a higher level. The actual settings required will vary in each system.
In the example in Figure 6 below, the best location for the sub (red line) has a dip at 70 Hz. The mains (black line) don’t have the same dip so they are allowed to run down to about 60 Hz to eliminate the dip. With this arrangement all dips below 100 Hz are eliminated. Below 100 Hz, EQ is required only to shape the response to match the target curve. A conventional crossover would fail to eliminate the dips regardless of the number of subwoofers. No possible subwoofer locations were able to remove the dip.
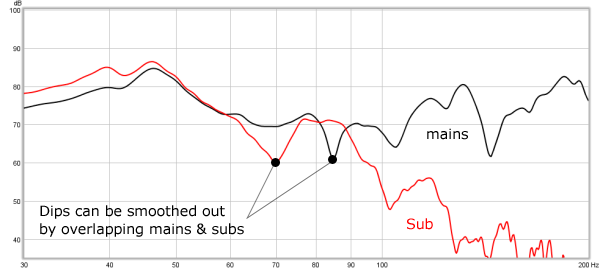
Figure 6. Overlapping the response of mains and subs to achieve a smoother response. High pass filter on the mains not shown.
Step 2. Measure the existing bass performance of your room
In this step, you will establish the performance of what you have now.
Nearfield measurement
First, take a nearfield measurement of your subwoofer, as illustrated in Figure 7 below. If there is a port, you will need to take a separate measurement with the mic near the port as well. Do the same for your mains, including woofers and ports.
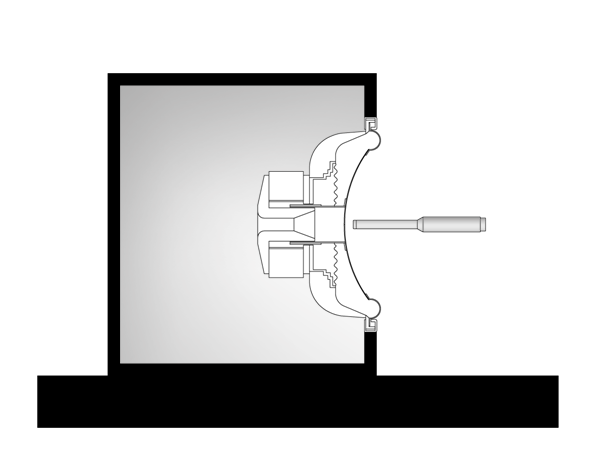
Figure 7. Nearfield sub measurement setup. The mic is placed approximately 1 inch from the cone.
Due to the close mic position, the room has no influence on the response measured, resulting in the smooth response shown in Figure 8, free from room effects.
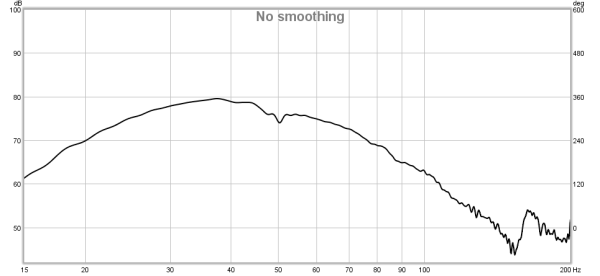
Figure 8. Nearfield measurement example (Rythmik servo sub)
Generate a waterfall plot of each measurement. As shown in the example in Figure 9, the waterfall plot confirms the absence of room modes in the response. We are seeing the response of the sub without the room.
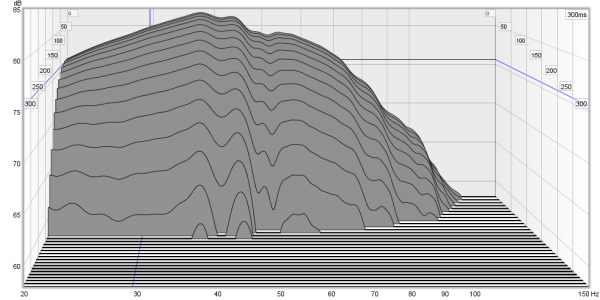
Figure 9. Nearfield waterfall plot
The decay plot in Figure 10 shows the same information as a waterfall, but it is easier to identify the precise drop in SPL at particular time periods. A waterfall more clearly shows modal ringing caused by the room. The decay plot shows a rapid level of decay without room modes. In the first 150 ms, we see mostly 20 – 30 dB of decay. This sets the limit of what we can achieve – as you will soon see, the speaker itself is certainly not the limiting factor in a real room.
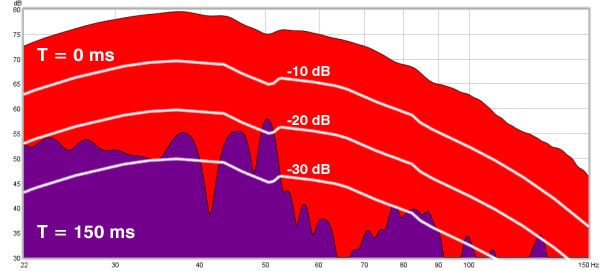
Figure 10. Nearfield decay plot
Please note: The white lines have been added to assist in identifying the decay but REW does not create them.
For more information on these plots:
In-room measurements
Now place the mic in the listening position so that it points downwards, with the end where your head would be. Run a series of measurement sweeps in REW, for each of the following:
- Left speaker only
- Right speaker only
- Left and right speaker together
- Each subwoofer individually
- Left and right speaker and all subs together
If you have more than one significant seat, repeat the measurements for each position.
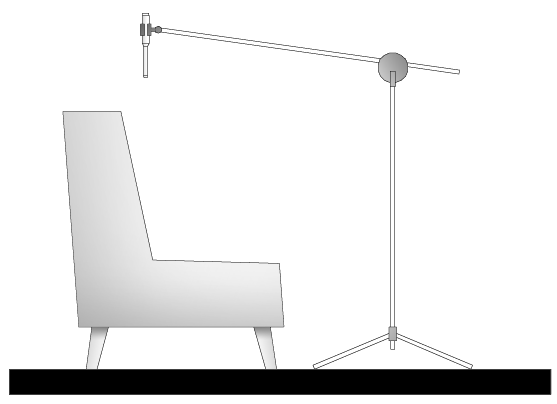
Figure 11. Measuring from the listening position
Now you can analyze your measurements by creating waterfall and decay plots for each measurement sweep. Note that is important to set the time window for both the waterfall and decay plots to 300 ms, otherwise the stated targets won’t make sense. The screenshot below illustrates the correct settings.
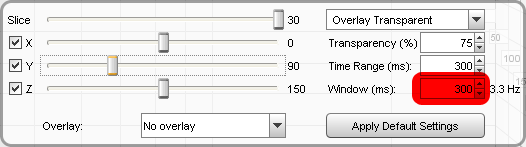
Recommended settings for waterfall plots
In the waterfall plot in Figure 12, you can see a great deal of modal ringing, causing extended decay times. One particular mode around 180 Hz is marked. The peak in response is minor, but it decays much more slowly than the region below. If not for the influence of the room, we would see the rapid and even decay shown in Figure 9. The large variation in decay time shows the need for acoustic treatment. The decay rate is as slow as 30 dB in 300 ms.
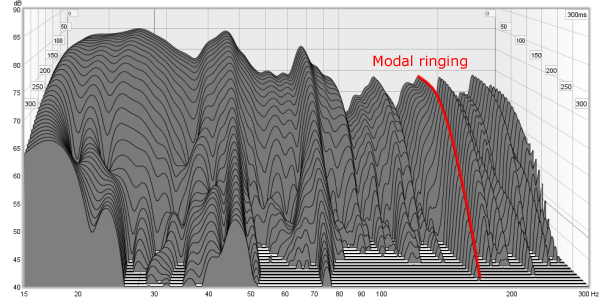
Figure 12. Modal ringing in a room without bass traps
The decay plot in Figure 13 shows the slow decay even more clearly, with the response shown in red, and the response after 150 ms in purple. The white line shows the target decay of 20 dB within a 150 ms time window. You can see that there is substantial modal ringing at many points, which cause the bass to sound exaggerated and boomy. The dips are less obnoxious in character but are still a problem.
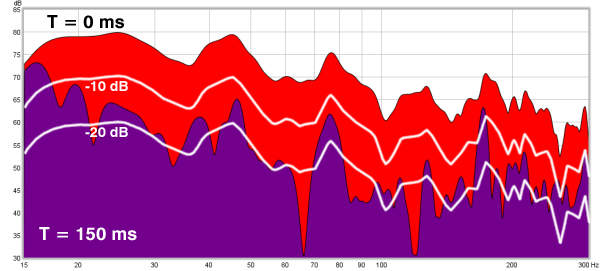
Figure 13. Decay plot before traps
Making sense of the results
Now you have a lot of measurements to analyse. You will find it helpful to view some of the response plots overlaid. Click on the All SPL tab and you can choose which plots you would like to overlay. You can also adjust their relative levels – click the controls icon above the top right corner of the charts.
- Frequency response. Compare your results to the performance targets. Apply third octave smoothing to the measurement of your mains and subs combined. Does the response fit the +/- 3 dB range up to 300 Hz?
- Waterfall. Now view the waterfall plot. In a well-tamed room the decay is even without any obvious modal ringing.
- Decay plot. Deselect all but T=0 and T=150 ms. Using the cross lines you will be able to estimate the decay at this point and compare it to the 20 dB target.
Save your measurement file with a descriptive name. It will prove useful later for the purposes of comparison.
Introduction to parts two and three
Nearly every system will fail all three tests above prior to undertaking a process such as described in the rest of this guide. In part two, we will mitigate the primary cause of most bass problems by treating the room. We will then use further measurements to better optimize the placement of speakers and subs. We will also determine if more subs will prove beneficial. In part three, more advanced techniques to complete the integration will be covered.
Further reading
The concept of overlapping the mains with multiple subs in order to smooth the room response has been suggested by Dr Earl Geddes (www.gedlee.com) on a number of online forums. See for example the thread Multiple Small Subs – Geddes Approach on diyaudio.com.
The house curve is explained by Wayne Pflughaupt in House Curve: What it is, why you need it, how to do it on hometheatershack.com.


Great presentation, and cleared up some missing points for me
Thanks Mr Spade 😉
Cheers
What’s the reason for pointing the mic down at the chair?
I have read (and tested) with it pointing to the ceiling and ~20 deg to the horizontal
Firstly I’ll mention that I don’t consider the orientation to be of any great signficance in this context.
However, there are two reasons for showing it this way. Firstly, the mic is not perfectly omni directional. A vertical orientation means that the mic gives preference to the horizontal dimension in terms of its omni pattern. We are a little more interested with horizontal modes. Secondly, the calibration files from Cross Spectrum are supplied for horizontal, vertical and 45 degree orientations.
You can of course test out the difference, although ideally you would need to swap the calibration file to suit each orientation.
The difference between the orientation I’ve shown and the one you are using is most likely relatively minor.
I have found significant difference with the results of room correction with mic orientation. With the mic pointed vertically the room correction result is better. I use acourate for room correction.
There is a bit of discussion at hometheatershack about mic orientation.
I have also used a cross spectrum calibrated mic and a calibrated (factory) earthworks M30.
I’ll also be interested to read what you think about setting the sub crossover (in the absence of a Geddes bandpass sub) to avoid localisation issues.
BC,
What kind of a difference have you found?
With a topic like this, it’s hard to cover everything in detail. I’ve written a draft version of the whole thing and a lot of the time was spent cutting out everything that wasn’t essential. Being a hobby-horse topic, I’ve had to be brutal! What I’m aiming for is for someone who has never used a mic before to be able to buy the tools and follow a process right away. I haven’t yet covered localisation issues, but after your suggestion I may include something.
Hey Paul
Fantastic article! I really enjoyed reading it and you bring some unique perspectives. A couple of questions that struck me when reading the article:
– what would you do if you do not have ability to crossover your mains? A couple of audiophile systems I have worked with we have run the sub off the pre-outs and the mains full range
– do you think we need to look at things in the bass with a resolution higher than 1/3rd octave? 1/3rd octave is not enough to resolve room modes which can have bandwidths of under 5Hz
Your decay time targets are quite similar to those that Jeff Hedback of HdAcoustics and myself have been discussing, except ours are for sounds to decay to -40dB by 400ms.
Hi Nyal,
Good to hear your thoughts. I was looking at your website and a post on the WB forum only yesterday.
Regarding the crossover. In the original one-part version I included two bass management schematics, but decided to include them later. Part one is designed also for those who will simply measure without committing to changing anything. One is a HT setup and the other a two channel. Back to your question:
“what would you do if you do not have ability to crossover your mains?”
I would add it!
I’d guess that some of your clients would not like this suggestion as there are all kinds of beliefs about the low cost DSP EQ/crossover units I’ll be suggesting. How do you handle that?
On my blog I’ve written about comparing different DSP units. A small group got together to critically compare them and we found they generally held up pretty well.
http://redspade-audio.blogspot.com/2010/12/active-crossover-listening-tests.html
“do you think we need to look at things in the bass with a resolution higher than 1/3rd octave?”
Absolutely! Measurements should be viewed unsmoothed most of the time, otherwise too much is obscured. However, I believe many will get caught up in pursuing perfect flatness. The eyes are more fussy then the ears! There is a tendency to try to correct things we can hardly hear. So this is why I’ve suggested that people aim for the target curve +/- 3dB after third octave smoothing is applied. That is a narrow range to aim for, but with smoothing applied it becomes a realistic goal. It’s been an interesting process attempting to define targets in such a way that a first time user can get a good result.
“Your decay time targets are quite similar to those that Jeff Hedback of HdAcoustics and myself have been discussing, except ours are for sounds to decay to -40dB by 400ms.”
With a 600ms window?
Certainly interesting to see what others are using. My focus had previously been on getting an even decay where modal ringing is damped. However, this is more difficult to define for my target audience. So I had to come up with something specific. So the decay target is one I’ve chosen based on results that I considered as reaching a point of rapidly diminishing returns. So it seems to me that when you get 20 dB consistent decay in the first 150 ms with a 300 ms window, that you will have also tamed modal ringing pretty well.
Hi Paul, thanks for your reply.
I agree that crossing over mains is a good idea IF it can be done transparently. Crossing over the mains reduces distortion and can make the main speakers play louder and more cleanly, with subjective improvements to clarity especially. Unfortunately most DSP and analog units introduce something, even if it is only a little, of their own character on proceedings. That combined with the audiophile mindset of short, simple signal paths = best sound quality and fear of anything digital signal processing / EQ related tends to put people off even trying it!
I also agree that people get carried away with pursuing flat frequency response when other things are more important – like clean modal decay. The only issue I had was if you encouraged people to look at only 1/3rd oct. graphs, since these can hide nasty suckouts and peaks. But you don’t seem to be saying that, so that’s great!
I think Jeff and I are working off a 500ms window, but I never checked with him, so let me do that and get back to you. I will investigate how your target compares to our target as well and get back to you with my thoughts.
Nyal
Thanks for your comments. There is one interesting test of DSP units that I’ve tried in two different systems. You need a switch box and a loop cable. Basically you switch from a loop cable to running through the DSP with no filtering or EQ selected. Essentially you are comparing the ADA conversion to a loop through cable. In the first test, John R was there and it was his MiniDSP – no one could pick a difference. In the second test in a different system and another group, we tried it with a couple of units with mixed results. Comments ranged from subtle to inaudible differences. It’s quite a revealing test because the instant switch tends to show if a perceived difference is real or not – audio memory is eliminated.
The “Target Curve” is speaker dependent? For monopole/box speakers the baffle step indeed would dictate such requirements, provided that both midrange and woofers are in 4pi space. The normal fact is the woofer would be in 2pi space on the floor, so the boost is already there.
For dipoles this target curve would be inaccurate. In fact if the woofer radiates to 2pi/half space, then the reverse applies. For example Linkwitz Orion utilises a shelving *highpass* because the woofers are on the floor, and the midrange radiates to 4pi.
The target curve applies to monopoles and I’m inclined not to speculate on how it applies to dipoles. It is intended to factor in listener preferences and typical source material and it is taken from a listening position measurement. Actual listening levels will also have an impact on the target curve. If you look at the equal loudness contours you see that as the levels go up, less SPL increase is required for a perceived doubling of output. It’s important to do all the steps in the guide, which will be included in parts 2 and 3, before using a target curve. Acoustic treatment and EQ in particular lead to a different target curve. Bass traps in particular can make the bass sound as if the level has been reduced.
Great primer Paul. The web needed a tutorial like this as many are still quite naive in their approach to properly integrating subwoofer(s) into their systems. I know several who still believe in using their ‘ears.’
Paul
Thanks for the great article. Are you arguing that it’s best to high-pass mains / low-pass subs rather than running mains full range with subs just low passed? If so, then what is the rationale for this view? Also, the idea of a “bass boost” rather than a flat bass response is interesting. What is rationale for this approach?
Andrew
1. The high pass on the mains is probably advisable in most systems although it depends on a number of factors, especially the speakers in question. A high pass reduces excursion and protects vented speakers from very high excursion caused by content below tuning. In some systems the need for a high pass on the mains is moot. A high pass does introduce higher group delay and this will influence the decay plots, but in this guide we look at this lumped together with the room effects which are worse. In that context, higher group delay might not be a major issue.
2. Where a farfield measurement is taken, a flat response would not be a good outcome. If you place a speaker in a room that is flat in an anechoic chamber on axis, it will not measure flat in a real room. The bass sound will be heavily altered by modal decay and large peaks and dips. This guide will show you how to remove the dips and peaks and damp the modal decay. The result if you then have a flat farfield response is not very appealing. You might get it flat to 10 Hz but it may sound as if there is less bass than with mini monitors. It is not a balanced result. Therefore you need to create a target curve that works with your typical source material. This is something that you need to try out in your own room allowing for both your own preferences and source material.
Great read as usual Paul.
Figure 8 (unsmoothed nearfield sub response) and Figure 9 (waterfall of same), appear to go against the maths.
There’s clearly no modal interaction (ie the room is not interfering), but on a quick calculation, the first (floor) reflection arriving at the mic should be only approx 1.4 ms after the direct sound (assuming the mic is 25mm from the driver and approx 250mm off the floor).
A 1.4ms path difference should mean measurements below 715Hz don’t mean much (f=1/s).
Both figure 8 and figure 9 clearly tell a different story.
Does this mean close mic’d measurements for woofers are valid and we can stop trying to hang our woofers from skyhooks to simulate anechoic measurements?
If so, where does that leave the maths?
Mike
The mic is close enough so that the direct field dominates the measurement, hence gating is not needed. Near field sub measurements are interesting to see but below the Shroeder frequency of a room, it’s the farfield response that is most useful. In other words, the measurement that is dominated by the room is what we hear and what we have to deal with. For the purpose of this exercise, it’s good for people to see the two measurements.
Hopefully this discussion is not taking you away from the next installment, which is awaited with eagerness.
Ignoring gating of the measurements (I’m assuming there is none?), your figures 8 and 9 above imply that close mic’d measurements at bass frequencies are valid to calculate the speaker response in a room (ie exluding the room) and apply room eq after.
I have particular interest in this topic as I’m trying to work out the best method of measurement/calibration using my DEQX (which has both speaker (anechoic) eq and room eq) and my current thinking (before reading this) was that calibration of the woofers had to be at the listening position.
Please feel free to push me to another forum to discuss this issue
Again I hope this doesn’t distract you from the higher priority of getting the next issue out
Mike
ps the “House Curve” links have been inspirational
Mike, you might say that the nearfields are educational in this process. The idea is to show how the decay and response are both altered by the room. In so doing, you can see that the room is the weak link.
Above the Shroeder frequency, you want to deal with the direct field regarding calibration with some attention also given to off axis response. Below the Shroeder frequency you want to deal with the farfield response measured from the listening position/s. That works out quite well because you can take gated measurements in a room down to about 200 Hz for the direct field calibration and then measure below about 200 Hz from the listening position. If your room isn’t large enough then you can take your speaker outdoors and elevate high enough to gate out the ground reflection, but that’s another topic.
So when’s Part II coming?
Part II is coming (hopefully) in one week.
Can you share the tool you used to add the -20dB white lines to the REW Decay plot? This makes the analysis considerably easier. Very useful article, thanks.
Jerry, it would be a nice feature to have built into REW, but it was drawn manually, it can be done with an image editing program.
That’s what I figured, Paul. Thanks for confirming.
I don’t get the point on the ” close mic position” . Why the room doesn’t have influence ? Near field and reflection free are different . Being “close” does not mean there are no waves being reflected back to the mic .
Due to proximity, the direct field dominates as it is much higher in level. The degree to which this occurs is clearly seen in the waterfall plot.
Paul,
It’s great that three years later this 3 part tutorial still remains one of the best I’ve seen. Thank you for the comprehensive guide. One thing I would point out is that I had to read to part 3 before I realized that the overlapping mains and subs approach won’t work with even a sophisticated AVR alone. Most AVRs I know of only allow for a single cross-over point. While you can always boost the bass level, it will only boost the signal routed from the mains to the subs below the cross over frequency. That’s a bummer for me since I recently bought a Denon AVR x3000 that won’t let me implement this scheme. I wonder if it still might be possible with the introduction of say a miniDSP 2×4. Any thoughts on that?
It’s quite unfortunate how AV receivers can be limiting in bass integration options.
Keep in mind overlapping only offers a benefit where the mains smooth the bass response of the sub positions. This won’t always be the case. I’ve seen many examples in my consulting work where one or two subs can’t be improved in this regard with overlapping. In fact, often just one or two will reveal the full potential of a particular room. So you should determine if you will actually achieve a benefit as it may not be there.
If you find you DO need overlapping, then I’d set the mains to large and use MiniDSP to create a high pass for the mains.
Like many others here, thanks for this awesome guide!!
As per the instructions, I started with measuring around 1inch from my Rythmic subwoofer cone. I am quite alarmed to find that below 80Hz the decay is not as you have described. At 300ms there is still a lot of energy below 80Hz. I am mystified by this. Any ideas why? I could email screen grabs as well as the REW file.
Hi. Great article!
I can´t wait reading parts 2 and 3.
In “Making sense of the results” step 2 I try to plot waterfall or decay curves but the “generate” button doesn´t work. I mean, REW only generates a graph with the measurements curves, not the average curve.
Thanks