Sound correction in the frequency and time domain
When we play a hi-fidelity recording in our listening room, the sound that we hear is the product of many things: the performers, the recording environment and the skill of the recording engineers, the quality of our playback electronics and loudspeakers, and the room/acoustic environment in which we are listening. It is towards the end of this chain that this article focuses: what happens in the speakers and the room that degrades the listening experience and makes it “less than it could be”? This is a complex topic, and it is important to look evenly at all aspects of it.
In this article I will touch on some of the complexities in the topic of “room correction.” The term itself could be a bit misleading – when we look scientifically at what is happening, we see that this is a question of applying available technology to remove distracting and psycho-acoustically misleading elements of the sound that reaches our ears. This could include both older means such as amelioration of acoustic problems with physical (acoustic) methods, as well as newer and more advanced methods of treating the signal electronically. In this article I will look at the latter and try to provide some greater understanding of the possibilities. While some specifics do of necessity refer to my AudioLense product, the discussion is about the principles involved.
Room correction is as old as hifi itself
In my work on room correction algorithms, one thing I have come to realize is that many audiophiles don’t realize that room “correction” is to some extent already part of all quality loudspeakers. In fact, one thing that separates good speaker designers from the rest is their ability to design speakers that work quite well in real rooms.
The biggest room-related challenges are typically below 1 kHz. In this region, conventional speakers transform from 180° front-radiating to being 360° omni-radiating. As a result, the on-axis response drops by 3 to 6 dB between 1 kHz and around 150-200 Hz. But things get even more complicated. Around the Schroeder frequency – typically between 100 and 200 Hz – the overall shape of the frequency response starts to rise as more and more of the reflections are in phase with each other and the direct sound of the speaker.
A well-designed speaker has some of this under reasonably good control through correction built-in to the crossover and clever driver placement. If the manufacturer’s recommended speaker placement is followed and the room has a sonic footprint that matches reasonably well with the environment the designer has anticipated, then the room correction built into the speaker works pretty well.
However, not all modern speakers are equally well designed in this regard and there is also a big if with regards to how well each individual room fits the idealized situation. And, regardless of how well a speaker is designed, the region around the Schroeder frequency is often an ugly place, acoustically speaking. This interaction is often a one-of-a-kind that is very difficult to correct with resistors, inductors and capacitors.
Nonetheless, one of the biggest advantages of the old way of doing things is that it is done by skilled professionals in a controlled environment. The crossovers may not be perfect and neither will the room correction. But everything has been tested and measured and tweaked professionally.
Room-speaker interaction
The interaction between the speaker and the room plays a large part in the quality of the audiophile listening experience. When we talk about sonic degradation, it is relevant to distinguish between linear distortion, nonlinear distortion and noise. The type of sound correction that is most often used in hi-fi systems (tone controls, equalizers, room correction) addresses linear distortion.
Linear distortion is errors in the frequency domain and time domain. Parts of the output are either too strong or too weak, and parts of the output come out at the wrong time, and usually several times. Mathematically and acoustically, timing and frequency errors are two sides of the same coin. Everything that goes on in the time domain goes on in the frequency domain also – it only looks different. But psychoacoustically, frequency errors are usually far more audible than timing errors.
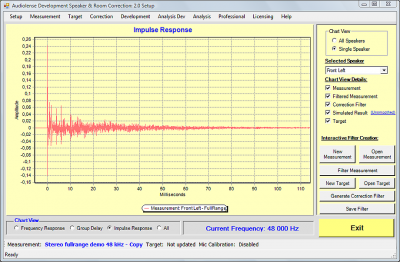
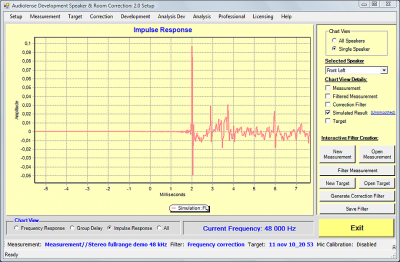
In terms of signal theory, the speaker acts as a filter and so does the room. Technically speaking, the impulse response of the speaker is convolved with the input signal, and the impulse response of the room is convolved with the output from the speaker, before it reaches the listener. Typically, we consider the speaker and the room together when discussing room correction. Here, for example, is the impulse response of a typical speaker-room combination (click to enlarge):
This plot represents the signal that results if the speaker-room combination is excited with an impulse (hence the term “impulse response”). This is easier to explain if we assume that all signals are digital (and we will just accept that similar reasoning holds for analog signals). In that case, an impulse consists of a single sample with value 1 at time zero, with all following values set to zero. The impulse response, then, is what the system will produce in response to that impulse. An ideal system will produce exactly the same thing on its output; but as you can see by the plot above, a realistic impulse response is far from that.
When a music signal is played through the system, the system receives a series of input values 44,100 times per second. It responds to each input value with a scaled version of the impulse response shown above. For example, if the input value is 25343, the system’s response is the same as shown above, but 25343 times larger. If the input value is -400, then the system’s response is 400 times larger than the above, and also inverted.
Then the next input value is received, and the system responds to that too, and adds the new response to the response it is already having. And the same for the next, and the next, and the next. At any given time, the system is thus responding to thousands of input values that occurred one after the other. (It may not sound very intuitive, but this is the best way to explain it without using mathematics.) Note also that because of this, the system is still continuing to respond to the input signal for some time after the input signal ceases.
What we as listeners make out of this tail is very different from what we can read out of the impulse response chart. Some of it will sound as room acoustics. Some will have a masking effect, preventing us from hearing everything that’s on the recording. And some of it will color the music.
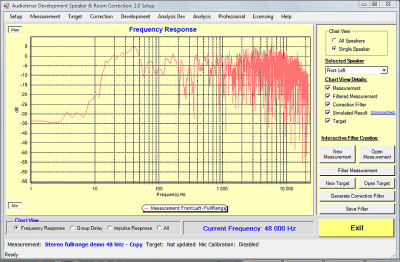
Here is the frequency response that corresponds to the above impulse response (click to enlarge):
The frequency response reveals different information than the impulse response. This speaker measures as if it has serious issues throughout the midrange. And it sounds that way too. Regardless how it looks in the time domain, something like this will always have an unnatural timbre – it exhibits a good amount of the typical problems in the lower midrange and upper bass.
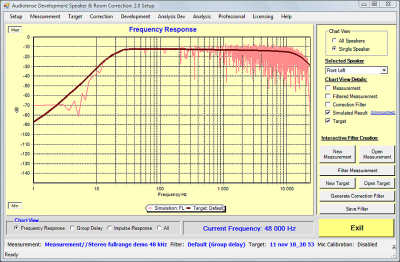
When we use FIR (finite impulse response) filters to correct the sound, some of the alterations that the room-speaker combination does to the music are inverted – that is to say, “corrected.” Here, for example, is a corrected frequency response of the above and the target that was used for correction. This correction will produce a much more correct timbre throughout the speaker’s passband.
Note that the comb filtering evident above a few hundred Hz is still present – we have not attempted to “correct” for this. More on that later.
Let’s return to the time domain again, and apply a time-domain correction algorithm. What we mean by this is that the correction algorithm is attempting a deliberate rearrangement of the time domain behavior of the speaker and room towards a target. Basically, we aim to get a specific impulse response for a limited time window. Inside this time window, reflections are suppressed, phase errors in the speakers are corrected, and so on.
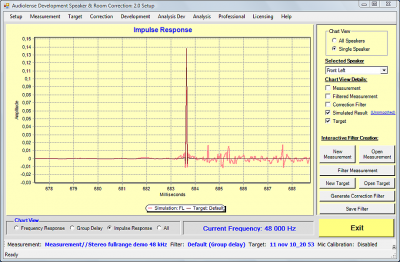
Here’s the impulse response after applying a time domain correction algorithm:
The time domain correction usually sounds more near-field like. The timing improves and some of the impact from the reflections is cleaned up so you hear deeper into the recording. The time domain correction in Audiolense works very well most of the time, but there are instances where a pure frequency correction works better.
By way of comparison, here is the impulse response obtained after applying a similar frequency correction, but this time with a minimum phase filter. With this type of correction algorithm, the goal is basically to correct the frequency response. The time domain will change here also – it will always change when the frequency domain behavior is modified, as the time domain and frequency domain are duals of each other. However, the changes in the time domain are not specified with respect to a desired target. In the above example, the time domain behavior is quite similar to how it was before correction.
Note that while these are simulated responses, they are a fairly accurate representation of how actual speakers measure after correction. When frequency-domain correction is done well, the changes in the time domain are to a large extent irrelevant to sound quality, with a few exceptions. One of the exceptions is for instance when you correct a speaker/room that has a very high Q bass alignment, the resulting impulse response will show less ringing – in effect, the Q of the system is lowered.
What’s hidden underneath these charts
Whether you look at time domain charts or frequency domain charts, you don’t get to see the whole picture of what’s going on. The room is a part of the system that transforms an electrical signal into sound waves. And acoustically it is a part of the transducer system. There is no clear distinction of where the speaker sound ends and the room begins.
If you play a violin note that lasts 3 seconds, basically all reflections in a normal room will blend in and modulate the “direct” sound. If you play a drum kick, the sudden rise will basically come directly from the speaker and the room reflections will to a larger extent impose themselves as a separate event.
Waterfall plots are very popular supplements to frequency response and impulse response plots to assess speaker and room sound quality. But waterfall plots basically tells what (perhaps) happens after the music has been turned off. It is at least as interesting to see what happens while the music is still playing.
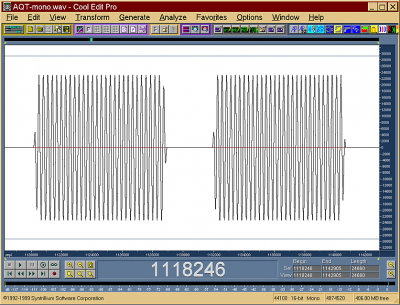
Angelo Farina et al have refined a method they call Acoustic Quality Test, described in the paper AQT – A New Objective Measurement Of The Acoustical Quality Of Sound Reproduction In Small Compartments (click for PDF). They play sine-wave bursts through the speakers, recording the output, and study how the sound pressure changes over time for various frequencies. Here’s the frequency bursts they use:
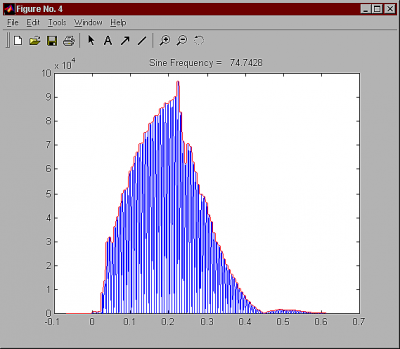
And here’s what might happen when the frequency is a resonance frequency:
What we see here is a gradual buildup of sound pressure. The longer the burst lasts the louder it gets. When the burst is silenced after about 0.2 seconds, the room plays for another 0.2 s before the note dies. This is perhaps not so unexpected, since we’ve all seen some of this in the waterfall plots.
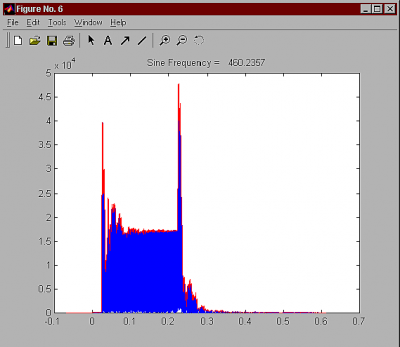
What is more interesting is to look at what happens when a burst is played at a frequency where cancellation occurs:
As we see above, the initial sound pressure level is quite decent. But the direct sound is quickly canceled as the reflections set in. The sine sweep is attenuated significantly. And when the burst ends, the room keeps playing – but this time without fighting against the speaker, so you get a big overshoot of sound. If you correct for the stationary signal (when the burst is on and all reflections have stabilized) you will get too high a level at the beginning and at the end. And as a general rule, too high is worse than too low, because too high will mask neighboring frequencies whereas too low will only be masked itself.
You can safely assume that most of the dips in the comb filter in the upper frequency range of the speaker has a somewhat similar behavior. It sounds a lot louder than it looks on the frequency plot. And part of the time it is a lot louder too.
These two chirps are merely examples. Most frequencies tend to behave quite nicely, while others will be a combination of the two we studied here.
If you listen to classical music, or basically any music with “long notes,” very late reflections can blend in and distort the music. This is not only a hi-fi phenomenon either. You can even hear it in the opera when the soprano fires on all cylinders.
Discussion
It is often assumed that only early reflections color what we perceive as direct sound. But as I have tried to show above, even very late reflections will modulate the direct sound if the tone lasts long enough. Since more and more reflections blend in the longer the tone lasts, the sound pressure of a “constant” tone will not be constant in the listening seat.
You can’t fix this sound pressure level variation with a pure frequency-domain correction algorithm. But, if you choose a level for the correction that gives the best possible tradeoffs between too loud and too soft you will usually get something that sounds pretty close to correct. I suspect that most of those who claim that “You can’t correct dips because …” and “It produces a hollow sound if you try,” have listened to dip lifting where the stationary signal has been given the correct level, but where there are temporal overshoots at the start and end of the note – temporal overshoots that have been lifted several dB over the target response because the DSP tweaker didn’t know better.
Audiolense doesn’t use Farina et. al.’s Acoustical Quality Test for filter generation, as AQT does not give predictable results after correction. Audiolense therefore uses proprietary algorithms that account reasonably well for how the reflections modulate the direct sound and that give a more predictable outcome after correction. But AQT does provide a very valuable understanding of what goes on between the speaker and the room while we listen to music.
The ability to deal with how the room and speaker interacts in an adequate way is at the heart of quality differences between various sound correction offerings. With conventional (IIR-filter based) EQ you will not be able to manufacture a correction that precisely supports your target response, even if you knew where you wanted to go. And you probably will not know what you should correct either because EQ-based solutions are seldom or never equipped with adequate speaker/room measurement and analysis tools that tell you how things are working in the listening spot. In any case, you will typically get a series of undesirable overshoots and undershoots simply because the biquads that do the work behind each EQ band aren’t capable of producing the opposite frequency response shapes of what you want to remove.
Moving from IIR-based EQ to tailor-made FIR filter correction is a step up the quality ladder, because it enables you to obtain a much more precise correction. If the FIR filters have a duration of a few hundred milliseconds they will usually be effective in the deep bass – if they are too short you will not get a proper bass correction.
With flexible and capable correction tools at hand, the next step up the quality ladder is how the measurement is analyzed and prepared as the basis for implementing a correction that matches well with how it actually sounds. There are in fact methods that correspond far better to what you hear and to what you should correct than typical approaches based on 1/n-octave smoothing or a clear-cut x-millisecond time window.
Doing various amounts of time domain correction is yet another potential step up the quality ladder. A time domain correction such as provided by Audiolense and a few others will correct the sound pressure level variation across the time window where the correction is effective, which is probably one of the reasons that adding time domain correction usually sounds better than just a frequency domain correction.
With time domain correction, it is quite variable how much should be applied. Sometimes it just sounds the same when you add more, and other times there is a break-even point that varies from room to room. Time domain correction in particular is very sensitive to measurement artifacts and measurement quality, and depends on good overall performance from the hardware (low distortion and high linearity). I don’t like to see a lot of grit and noise before the main spike of the impulse response when the user is aiming for a time domain correction.
When I work on improving the correction algorithms I use headphones for evaluation. In this scenario, I can apply almost insane quantities of time domain correction and get away with it. It works as a sort of magnifying glass – then it is easy to hear that the corrected version has significantly less room coloration added than the uncorrected. This proves to me anyway that DSP has some capabilities towards negotiating room effects in a very fundamental way. In a real setup you have to settle for less time domain correction or you will get audible correction artifacts. The time domain correction doesn’t make the room disappear acoustically. But it usually changes the perceived sound quality towards a few dB more direct sound, and there is also a measurable improvement.
Acoustic treatment and DSP is a very potent combination. Acoustic treatment can negotiate all issues except the deepest bass very well. You can basically choose the decay pattern in the room by design. DSP can complement and perhaps even do the heavy lifting in the lowest octaves time domain wise where the size of effective diffusers and absorbers takes on enormous proportions.
When the time domain is cleaned by room conditioning the frequency domain becomes much smoother too. The roller-coaster frequency response is reduced to a bumpy road. Some of the bumps will be due to a speaker that was a bit bumpy out of the factory, and others will be remaining acoustic problems. DSP can then be used to almost completely eliminate the frequency bumps, and to tighten up the time domain behavior further, taking the system up to a level of sound quality that is unattainable without both acoustic conditioning and DSP. The combination of acoustic treatment and DSP is a very potent one.


Good article Bernt
Thank you, Norman.
Glad to hear that you like it.
Brent is oh so right, listening to the gated sine sweep is very illuminating as to how the room plays music. This reminds me of the MATT (Musical Articulation Test Tones) we did way back in the mid 80s. Take a listen to Track 19 on Stereophile Test CD, Track 19 (1992). Or read about it the MATT test and download a free test signal from http://www.acousticsciences.com/matt.htm and there is even a listening tutorial on that page. You can hit play and actually hear what Brent is talking about.
Back then, still today, we worked exclusively in real time. We didn’t apply a sine sweep to the room, get an impulse response and then generate a synthetic test signal (Figure 6) put headphones on and listen to it. That was way too much work, too slow and cost too much in analog. Mainly back then we were all pretty much into instant gratification (joke). In the mid 80s our first distribution of that test signal was on a 3 minute loop cassette. We just played the tape and listened to it. Then you could record what you heard, make changes in the room and record what you now heard. You could easily recognize what improvement, if any, you made, and you could listen to the A/B test any time you wanted to. Life was simple back then, before DSP.
Here’s what you want to do. Just listen to the original version, the electronic MATT test over headphones and then power up your system and listen to the signal again. You will be immediately astounded about what it reveals to you about your room’s ability to play music. You don’t have to look at graphs that are meaningless, just listen. It is amazing and a little humbling to hear your room actually gargling note sequences instead of yodeling them.
Norm, you had some experience with the MATT testing we did back in the early days when you were working for Bruce Brisson at MIT on our 2C3D listening room project. And just think, you didn’t even recognize that this test is derived from the MATT test. That’s how convoluted this Italian offshoot of the MATT test has become. Let me quote Angelo Farina, the author of an AES paper delivered in 2001 where AQT was first presented. In his introduction he states that his present work is “an evolution of the MATT test…” There you go…
If psychoacoustics says above a few hundred hertz we can largely hear through the reverberant sound to perceive the direct sound, I suspect that this approach is overcorrecting.
Arg,
You can largerly hear past room reflections at high frequencies, but the reflections will still create an uneven frequency response that causes audible colorations. At higher frequencies some of this will even sound as nonlinear distortion, such as an ear bleeding tweeter. The sorts of correction that was presented above can lead to a very pleasant sounding top – airy and clear, but at the same time without the usual artifacts that produces listening fatigue.
Overcorrection can be many things. In my book it is what you get when you correct a cancellation so much that you get temporal overshoots of several dB, and the infamous “hollow sound” when someone tries to equalize the bass to perfection. This can be avoided by using an approach such as Farina’s AQT or similar. Using such an approach will not lead to overcorrection, but will help avoid it.
In any case, it is important to use a tool that enables a high degree of manual voicing to get the best possible result. Measurements and correction templates can get you in the ball park but the fine tuning has to be done by ear.