Listening-Room Reflections and the Energy-Time Curve
With Jeff Hedback.
Introduction and scope
In our listening rooms reflected sounds – sounds that bounce off walls and other objects – are more often louder than the direct sound from our loudspeakers. They are therefore an important factor in determining sound quality.
By reading this article you will understand how reflections effect our perception and what kind of acoustical measurements can be used to look at reflected sounds. Finally a set of acoustical measurement standards for reflections will be proposed that you can use to look at the reflections in your room and determine what changes need to be made to your acoustic design to improve sound quality.
What are reflected sounds and where do they come from?
The direct sound can be defined as being the set of sound waves traveling in an unimpeded path from the speaker to the listener. If we listened to music in an anechoic chamber then all we would hear would be the direct sound from the loudspeaker. There would be no reflected sounds since any sound waves reaching the boundaries of the chamber would be fully absorbed. All of the boundaries in our listening rooms (i.e. ceiling, walls, floor), however, are semi-reflective, meaning that they reflect some of the incident sound waves back into the room.
Why is it important to care about reflected sounds?
When we listen to music on our stereo system in rooms that are the size of those found in most typical homes we are more often than not listening at a distance where the sound pressure level of the reflected sounds is greater than that of the direct sound from the loudspeakers. We would instinctively suspect, therefore, that reflected sounds are equally if not more important to our perception of music than the direct sound. Measurements published by Toole (chapter 18) show that the frequency response measured at the listening position above around 250Hz (*) is dominated by the spectral characteristics of the sound energy returned to the listener from the major reflection points in the room i.e. the first reflections from the floor, ceiling, front wall, side walls and rear wall. Below 250Hz room modes become the dominant factor in what we hear. This has two important implications:
- The off-axis response of the loudspeaker is critically important in determining the frequency response at the listening position. For example the ceiling reflection is typically at angles of between 40 and 60 degrees vertically off axis.
- The acoustic characteristics of the major reflection points significantly influences the frequency response at the listening position. The characteristic of the boundaries is therefore ‘imprinted’ on the spectrum of the sound reflected back from the major reflection points.
If we use 1-inch thick fiberglass at a reflection point then we will be absorbing most of the sound above 1000Hz. Frequencies below this will be unaffected and so the overall sound we hear will now be timbrally distorted. The reflections are now also spectrally different to the direct sound, which can create further issues with regards to other aspects of how we perceive sound as we will see in the next paragraph.
(*) The exact frequency at which the response at the listening position becomes modally dominated depends on the volume of the room, the amount of absorption within and other factors. For the purposes of this article I use 250Hz but it can be as low as 150Hz or as high as 350Hz.
What effects do reflections have on our perception of music?
The effect of reflections on localization – the perception of where in space a sound comes from – has been investigated extensively. The body of evidence is sufficient for the perceptual effect to be given a name – it is called the Haas effect, precedence effect or ‘law of the first wavefront’. It states that if the same sound arrives at the ear from two different directions at two different times (e.g. one arriving from the left and another one from the right 10 ms later) then the perceived location of the sound corresponds to the direction of arrival of the first sound. This ‘law’ holds true up to about 40 ms.
Our spatial perception of image size and position is also effected by reflections. Strong reflections generally shift the apparent position of a source in the direction of the reflection and make it appear larger. Another important effect of reflections is how they influence our perception of timbre or tonal color.
All of these perceptual effects are summarized extremely clearly by Benade (1985) [Ref. 1], who wrote:
“The auditory system combines the information contained a set of reduplicated sound sequences (authors note – i.e. the direct sound and its reflections) and hears them as if they were a single entity, provided:
a. that these sequences are reasonably similar in their spectral and temporal patterns,
and
b. that most of them arrive within a time interval of 40 ms following the arrival of the first member of the set.
The singly perceived composite entity represents the accumulated information about the acoustical features (tone color, articulation, etc) shared by the set of signals. It is heard as though all the later arrivals were piled upon the first one without any delay – that is, the perceived time of arrival of the entire set is the physical instant at which the earliest member arrived (authors note – this is known as the precedence effect).
The loudness of the perceived sound is augmented above that of the first arrival by the accumulated contributions from the later arrivals.
The apparent position of the source of the composite sound coincides with the position of the source of the first-arriving member of the set, regardless of the physical direction from which the later arrivals may be coming.”
We have added bolding to reinforce the importance of similarity in the spectral content of direct and reflected sounds. As we will see in the next paragraph, the traditional acoustic measurements used to examine reflections do not allow us to analyze the spectral content of the direct and reflected sounds and therefore cannot allow us to fully understand the perceptual effects of the reflection pattern in your room.
A detailed discussion on these perceptual effects, including summaries of a large number of listening studies, can be found in Toole’s book [Ref. 3] in chapters 5 through 11.
What acoustic measurements can we use to examine reflections?
The most commonly used acoustic measurement for examining reflections is the ETC (Energy Time Curve). At this stage it is worth briefly talking about what an ETC is and how it differs from a frequency response measurement. Frequency response, as shown by the Fast Fourier Transform (FFT) of an impulse response (IR), adds up all incident sound within the IR gates to produce a plot of amplitude vs. frequency. This plot shows the sound pressure level at different frequencies of the spectrum. An ETC can be thought of as a time domain view into how the spectrum builds up. Each peak on an ETC after the direct sound is a reflection. The ETC is simply looking at amplitude over time but it gives no insight into the spectrum of that energy.
Another type of acoustic measurement that could be used is one that combines time, energy and frequency in one chart. These – in their waterfall or spectrogram forms – are often used to analyze low frequency modal decay in small rooms. The benefit to using this type of measurement is that it contains spectral information – which is notably missing from an ETC. The problem with using this type of measurement in reflection analysis (i.e. above 250Hz) is that there are no acoustic measurement packages out there that I know of that provide these data views in a manner where trends and information can be visually interpreted. For such a measurement to be effective it must be presented with frequency axis smoothing (e.g. 1/3rd octave) otherwise the data is almost impossible to interpret.
What should the targets be for reflections?
The most popular approach is simply to analyze the level of reflections on an ETC and compare these to the direct sound, setting a target for the reflections to be 10dB/15dB/30dB etc lower than the direct sound after a certain number of milliseconds (ms). These targets appear to have been arrived at by people reviewing the results of studies that examined the threshold at which reflections caused perceptual effects and then setting the allowable level of reflections to be below these values. This approach is overly simplistic, since it does not examine whether these perceptual effects are good, bad or neutral. Listening tests summarized in Toole’s book reveal that most listeners actually show preference for high levels of reflections that are spectrally similar to the direct sound. The evidence is that they add to timbral richness and give body and fullness to images within the soundstage. We also know that ETCs are spectrally blind (i.e. they contain no information as to the spectral content of the reflected sound) and from Benade’s summary that the auditory system is discerning in its requirements for spectral balance between the direct and reflected sounds in a room.
In the absence of properly smoothed waterfall type measurements we must therefore rely upon the flawed ETC as a way of measuring our rooms and determining the changes we should make. In my recent white paper [Ref. 2] co-authored with Jeff Hedback we proposed that the ETC of the left and right speakers (measured separately) should:
- Be visually identical (with only minor deviations) from 0-40 ms
- Show that the peaks are down to at least -10 dB by 40 ms to prevent breakdown of the precedence effect
- Clearly show a decrease in the amplitude of energy over 0-40 ms. The decay pattern may or may not be continuous (**).
- Show the consecutive peaks of the highest amplitude reflections viewed across the time axis to be relatively smooth in pattern and density.
An important point is that examination of the ETC by itself is not enough to tell you if a room is good or bad. These criteria should be considered in conjunction with the other stated targets in the white paper for consistency of midrange decay time and left / right frequency response. Figure 1 shows an example of an ETC that meets these standards.
(**) A measurement may have a non-continuous decay due to, for example, a strong energy return from the wall behind the listener that is spectrally consistent as shown by analysis of 1/3rd octave filtered ETCs.
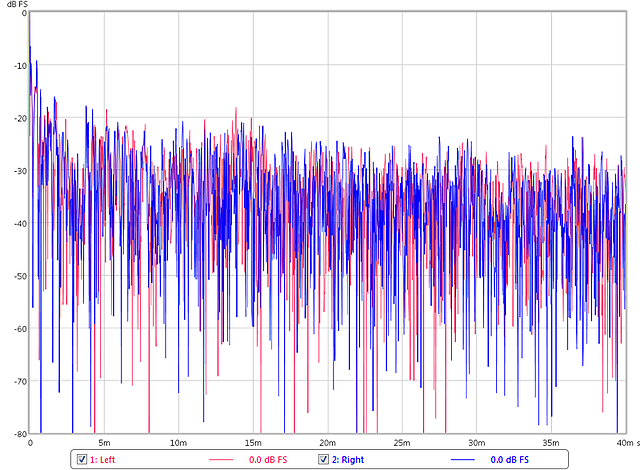
Figure 1. ETCs of left and right speakers in a room that meets all standards: similarity, smoothness and decay
Figure 2 shows an ETC with a ragged appearance to it, which warrants further one-octave band studies. Whilst this room does meet the criteria for decay of 10dB over 40ms it does not meet the T60 requirements explained elsewhere in our white paper– midband T60s are over 0.7s. This is actually seen in the general reflection pattern which has no decay (viewed by not focusing solely on peaks).
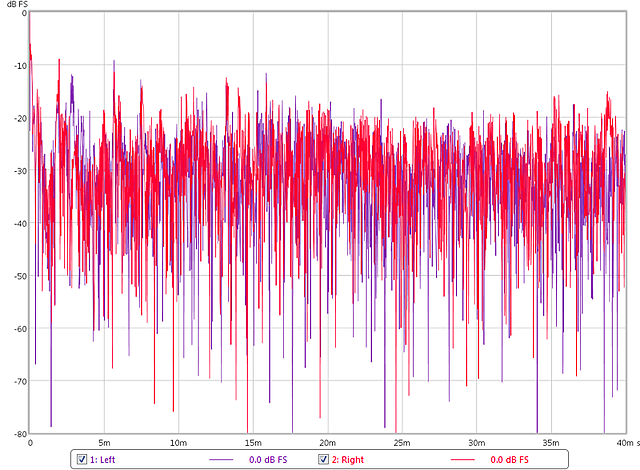
Figure 2: This room exhibits a ragged appearance to the ETC which warrants further one-octave band studies
We believe that deviations from the targets above warrant examining one-octave bandpass filtered ETCs at 500Hz, 1kHz, 2kHz and 4KHz. When analyzing these ETCs one should be looking for the following differences which, if present, are indicative of problems in the spectral balance of reflected sounds:
- Between the L&R loudspeakers in the same band (i.e. between the L&R at 500Hz)
- Between adjacent bands for the same loudspeaker (i.e. between the 500Hz and 1kHz for the L speaker)
By way of example, Figure 3 presents an ETC with a ragged profile. In Figure 4, we have filtered the ETC in one-octave bands, centered at 500 Hz, 1000 Hz, 2000 Hz and 4000 Hz. These plots show distinct differences in the spectral content. These differences are more clearly seen with some ETC smoothing. Figure 5 shows smoothed energy-time curves using a 1 ms moving average filter and a reduced vertical scale. Whilst the 500 Hz and 1000 Hz bands track each other very well, clear differences can be seen at 2000 and 4000 Hz. In this room these differences can be traced to the poor off-axis performance of the speakers and the presence of thick, fibrous wallpaper on all walls.
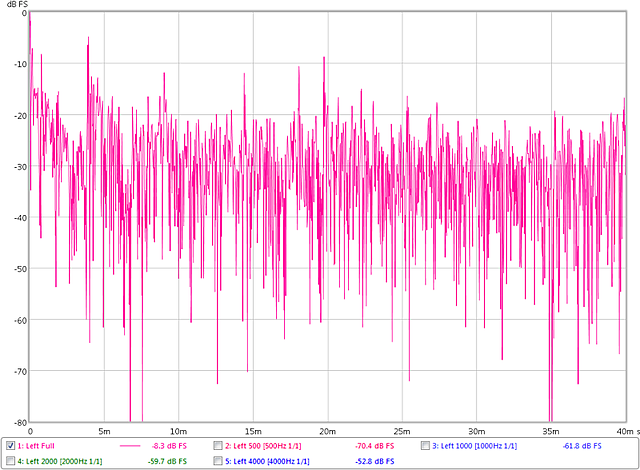
Figure 3. This ETC measurement shows a ragged profile worthy of further investigation
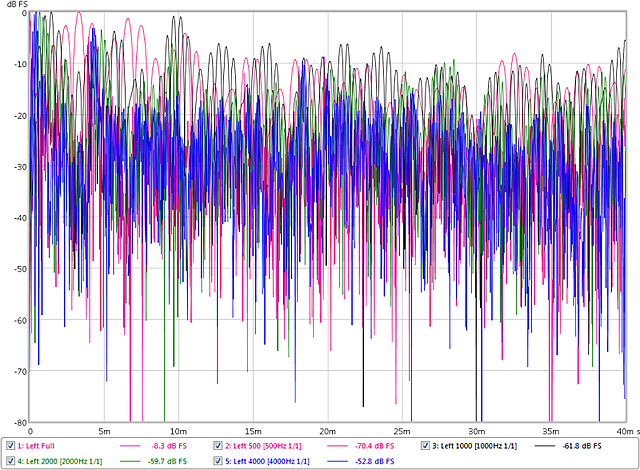
Figure 4. One-octave filtered ETCs at 500Hz, 1000Hz, 2000Hz and 4000Hz shows distinct differences in the spectral content
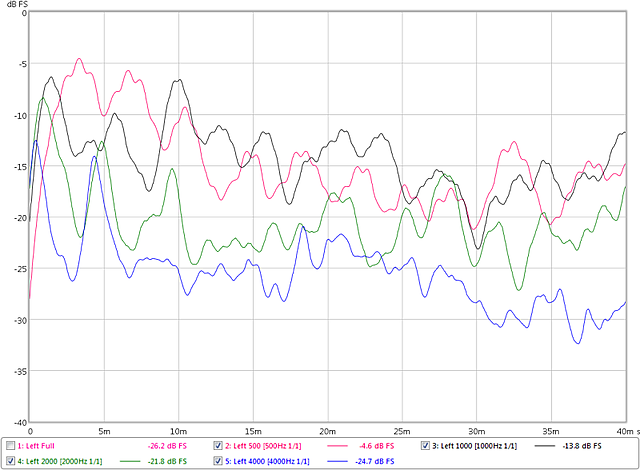
Figure 5. Smoothed energy-time curves using a 1 ms moving average filter and a reduced vertical scale
Concluding Remarks
By reading this article you should now have a good understanding of how important reflections are to what we hear and how to use ETCs to analyze the reflections in your room. Once you have analyzed the reflections in your room, or employed an acoustic consultant to measure and/or analyze your room, you might find that there are elements that do not meet the targets described here. The next question you will then have is “what changes do I need to make to meet the targets and maximize sound quality?” Typically, changes made might include altering speaker ‘toe in’ – which changes how the speaker interacts with the boundaries – and carefully selecting appropriate acoustic treatment to correct for dissimilarities in the spectral balance of reflected sounds.
Please add a comment to let us know what you thought of the article, how it could be improved, or what questions it still leaves in your mind.
About the Authors
Nyal Mellor is founder and chief acoustician of Acoustic Frontiers LLC, a company offering a broad suite of acoustic consulting services from listening room design to speaker placement and subwoofer integration. Acoustic Frontiers also sells products online in the categories of acoustic measurement, acoustic treatment and room correction.
Jeff Hedback co-authored the white paper mentioned in the article. Jeff is the founder of Hd Acoustics (formerly Hedback Designed Acoustics) a full-service acoustical design and consultancy firm specializing in unique needs of small room acoustics.
References
- Arthur Benade, “From Instrument to Ear in a Room: From instrument to ear in a room: Direct or via recording,” Journal of the Audio Engineering Society, Vol 33 Nr 4, 1985.
- Jeff Hedback and Nyal Mellor, Acoustical Measurement Standards for Two Channel Listening Rooms, Self-Published, 2011.
- Floyd Toole, Sound Reproduction: The Acoustics and Psychoacoustics of Loudspeakers and Rooms, Focal Press, 2008.


I like this article. I would also like to see more how-to’s using the ETC tools in adjusting diffusers. For example, http://www.jdbsound.com loves using predominantly sonotubes for diffusers. So far he has not divulged how to use ETC for adjusting them in the patterns he commonly uses. I would like to experiment with these concepts but need a few more articles on how-to use the ETC tool for that and send me on my way. I attend a church that has room acoustic issues but they assign no budgetary monies for it. Hence my diy approach and personal interest.
Peter.
Hi Peter
Thanks for your comment!
The use of diffusers in acoustically ‘large’ spaces such as churches is quite different than the way they are used in acoustically ‘small’ spaces such as listening rooms, home theaters and studios. The methodology and standards described here only apply to these ‘small’ spaces. I would hazard a guess that the issue with your church is more related to the overall decay time being too long due to lack of absorption and this resulting in decreased intelligibility. The single figure RT60 and STI (speech intelligibility) might be better metrics to use in your case.
Nyal
I recently got a Dayton Omnimic. I had been hunting the web to better understand the data. This article was VERY helpful in making sense of things. While frequency response is fairly straightforward, tests like the T60 and ECT tests didnt lend themselves to instant understanding on my part. The area concerning tracking the decay response at different frequencies was particularly insightful.
Thanks so much Nyal & Jeff!
Thanks Jim, I appreciate your kind words. The white paper (http://blog.acousticfrontiers.com/whats-new/2011/10/13/acoustic-measurement-standards-for-stereo-listening-rooms-pu.html) and this article are we hope moving forward the understanding of how to use acoustic measurements to analyze reflections in our listening rooms. I would encourage everyone to buy or borrow an acoustic measurement package and start analyzing their rooms. Getting the room right provides a solid foundation on which quality electronics and speakers can thrive. With the standards published in the white paper everyone should be able to analyze their room and see the areas in which performance could be improved.
Good article!
You have certainly explained the usefulness of octave-filtered energy-time curves.
Do many(or any) of the available measurement software packages allow for octave-filtered ETCs?
Hi John
Thanks for your comment! Room EQ Wizard and ARTA have the band filtered ETCs. All the graphs in this article were done in Room EQ Wizard.
Nyal
Hi
What makes figure one better than figure two? It’s not clear what is consistent or not. They both appear mighty jaggy. Perhaps you could circle the problems in one?
Hi Nathan, a couple of things:
– the presence of individual high gain reflections (Fig 2 has some major spikes visible on the ETC)
– the non-smooth decay (Fig 2 ETC goes down, up, down, up)
Hope that helps!
Nyal / Acoustic Frontiers
Great article!! One question: How do i make band filtered etc meassurement?
Hi Alex, per Nyal’s reply above, it can be done in Room EQ Wizard (REW) and ARTA. In REW, use the Filtered IR window and select the filter in the lower left corner of the window.
Great, thanks!!
For this reason, loudspeaker position should be out from the walls appreciably so the time and intrusion of reflected waveforms is made less significant. There is true ambient information contained in recordings made on location that we should want to preserve and speaker location with respect for the earliest arrival of reflected waveforms in room does help, significantly. I wouldn’t get obsessive about this if I were you, just do what I’ve suggested and add some aftermarket product for the absorption and/or diffusion of waveforms at the first reflection points and have the usher show you to your seat. Cheers.
I got interested in the listening rooms effect on the acoustic “behaviour” of loudspeakers for two reasons. 1) I built a three way speaker system with very good drivers (SS 18W/4741, SS 3004/660000) and two subwoofers, active crossover and separate amplifiers . I calibrated the SPL with help of measurements from a Omnimic, both regarding atenuation of the drivers and also adjusting for unevenness in “local soundpreasure” over the frequencies. I got a very good sound. But measurements also showed huge dips in SPL, at 50-70 Hz. The problem was/is room reflections. I moved the subwoofers into the room and that solved some of the problems.
2) I just inherited two loudspeakers Carlsson OA52 with passive crossover. I set them up with my amplifier and “fired up”. I got amazed! – The “stereo room picture” was enormously better with much better bredth, depth and a more accurate timbre of voices and instruments. One explanation probably is the way the speaker enclosures are designed. They supress unwanted reflected sound from the speaker drivers (wich usually has another frequency spectrum compared to the direct sound thus offsetting true high fidelity, beside the ordinary interference that affect the SPL).
Conventional speakers are usually designed as boxes, with no “facilities” for reduction of unwanted sound emmission from the drivers that causes disturbing reflexes in ordinary rooms. Usually what is dicussed when testing those speakers is SPL-evennes and distortion in acousticly dead rooms. I would like to know the opinions on how to design speaker enclosures that also take into account, and optimizes, speakers for use in ordinary living room – without having to refurbish/dampening the room. Would apprechiate views on how to solve this issue!
Thanks for the well written article and examples. Armed with your article and REW I compared the decay times as you outlined and found that my room exhibits the same decay time characteristics as figure 5. No small surprise then that the room sounds “dry” and like your example room in figure 5 it also has thick fibrous wallpaper on all walls and carpet.
So I’m curious as to what you might suggest for improvements and if there were changes made to the example room and how they worked out?
Acoustical Measurement Standards is now in my reading queue, thanks.