Bass Integration Guide – Part 3
This is the third and final part in this series on bass integration. In part one, a series of performance targets were established. A system that hasn’t been optimized is expected to have significant performance shortfalls. In part two, acoustic treatment was introduced as the foundational first step towards taming some of the problems discovered. In part three, speaker placement, bass management and EQ are covered.
If you are serious about getting the best bass possible, it is recommended that you read and apply this guide in sequence:
- Start with at least one high quality sub. (part one)
- Measure the existing bass performance of your room. (part one)
- Install acoustic treatment. (part two)
- Determine speaker/sub placement and the need for more subs.
- Apply EQ and complete integration.
Since this article is a guide rather than a case study, the data used comes from various systems and rooms that I have measured. All measurements have been taken with the free program REW (Room EQ Wizard).
Bass management – 2 channel systems
In a two channel system, a DSP active crossover (shown in red in figure 1 below) should be inserted between the pre and power amp. DSP is needed to provide a crossover, EQ and digital delay.
Required DSP features:
- 2 input channels and 4 output channels,
- independent high and low pass filters on each channel,
- up to 25 ms of digital delay to each channel and
- 4 or more parametric EQ filters for each channel.
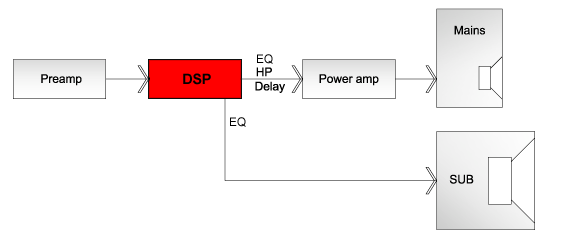
Figure 1. Two channel system configuration
The Behringer Ultradrive Pro DCX2496 is recommended for 2 channel systems, due to its capability to assign long delays needed to phase-align subs. MiniDSP is not suitable in a two channel system because it lacks sufficient digital delay capabilities for phase alignment purposes.
Bass management – home theatre systems
In a home theatre system, the receiver can provide digital delay to the mains, which will allow the sub to “catch up,” so that the bass can be phase-aligned. This means the DSP units no longer require long delays and miniDSP is suitable. DSP is inserted in between the pre and power amps on the mains, and added to the subwoofer pre out. If the AV receiver already provides the necessary features, then DSP does not need to be added.
Required DSP features:
- independent high and low pass filters on the mains and subs and
- 4 or more parametric EQ filters for each channel
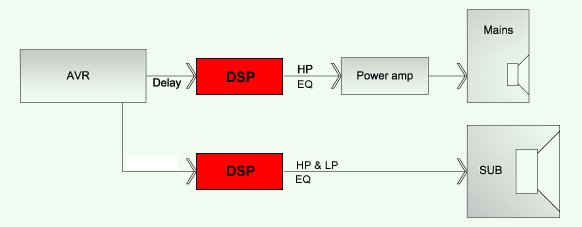
Figure 2. AV system configuration
In this example, the pre outs for the mains would be fed into a DSP unit such as miniDSP (2 in 4 out). Two outputs are then fed into the power amp. This DSP unit provides filtering and EQ to the mains potentially in the range from 40 – 200 Hz. Typically the bass management capabilities of AV receivers are limited and won’t allow the degree of optimization that is recommended here.
The second DSP unit provides filtering and EQ to the sub. One DSP unit may be used if it has 3 inputs and 3 outputs. miniDSP now have larger boards that can serve this function, although at the time of writing, dual 2×4 boards are still cheaper. A single Behringer DCX unit can also be used since it has 3 inputs.
More information about various DSP units and their various features >
Phase alignment
In the time domain, subwoofers typically lag behind the mains. The phase control provided on most subwoofers simply delays the sub further. It is like missing one bus then delaying your journey to the bus stop so that you arrive at the same time as the next bus. A better method is to delay the mains so that the subs can catch up. This topic is beyond the scope of this article, but one approach is covered by Rythmik Audio:
Speaker placement
In this guide we will consider only the bass response aspect of speaker placement. While the placement of the main speakers won’t usually be decided on the basis of bass performance alone, this aspect deserves some consideration.
There are two main components of in-room bass response:
- Direct field – the response of the speaker itself without the room and
- Room transfer function, including room modes and boundary interference effects.
Room modes have been discussed previously in part one.
Boundary interference
Speaker boundary interference response (SBIR) is usually discussed in relation to studio control room design. The three nearest boundaries to each speaker cause peaks and dips due to acoustic interference.
SBIR problems can be ameliorated with a number of strategies, including:
- Using different offsets of the main speakers to the front and side walls,
- Asymmetrical placement of left and right speakers,
- Corner placement to avoid all boundary offsets,
- Woofers mounted close to the floor, eliminating floor bounce and
- Soffit mounting speakers, which can eliminate all offsets.
Acoustic treatment is not generally very effective at taming boundary interference. It can prove difficult to eliminate boundary interference. Fortunately, boundary effects are less obnoxious than modal ringing which is more effectively tamed with treatment.
It’s also worth noting that the listening position has a role to play, especially the distance to the wall behind the listening position. To a certain degree, the listening position can be optimized with measurements as well.
More on SBIR >
SPL measurement levels
It is a good idea to calibrate the SPL level of measurements and run measurements at a consistent level. Over time you will end up with many different measurements and you may want to compare them. This is more easily done if the measurements have been taken at a similar level.
The SPL level should be chosen so that the system is not overloaded and the room doesn’t rattle. It should be elevated as high as possible above the noise floor without encountering problems. One common problem is that measuring a different sub location means a stronger room mode peak that causes clipping. You then have to turn down the gain and the SPL level is altered. Measurements from that point onwards can no longer be compared in terms of room gain. When you look back later, you may forget that the volume was changed and think that certain positions have more room gain. There is a work-around to avoid this problem.
If you find that you need to reduce the gain to avoid clipping, don’t adjust the gain arbitrarily. Instead, adjust the level in the measurement dialogue box shown below:
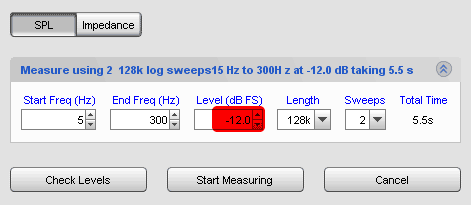
Figure 3. Adjusting the level of the measurement signal
If you had to reduce the level by 5 dB you can then compensate by increasing the level of the plot.
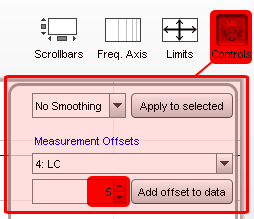
Figure 4. Altering the level of individual response plots
You will also notice the signal is bandwidth limited to 300 Hz. This results in smaller REW files. There is no need for a full range signal for optimizing bass.
Unfortunately, if you have done this, you can compensate the level in frequency response, but levels in the waterfall plots will remain at their original levels. Hence it will be difficult to compare waterfalls. You may decide to go back and repeat measurements at a level that works for all positions.
Calibration
Ideally you should have calibrated your sound card and entered a calibration file for your mic when taking your first measurements, but now that you will be relying on your measurements to optimize the system, it’s critical that you ensure they are accurate. If you are measuring with a laptop, this is especially important. Low cost PC built-in sound cards can be very good indeed with a ruler-flat response, but laptop sound cards can be very poor.
If you are measuring with a laptop then you will need an external sound card that supports duplex operation as well as a mic preamp and phantom power.
Step 4: Determine speaker/sub placement and the need for more subs.
Having now treated the room acoustically, we will now optimize the placement of the mains and subs. We’ll start with the mains and attempt to get a response that is as smooth as we can achieve. Then we’ll survey suitable subwoofer positions to investigate further. I’ll show a method to determine this quickly without lugging the sub around. Then we’ll start to measure the speakers and subs together and optimize their calibration.
Measurements for placing your mains
Start with your mains in their current position and place the mic in the listening position as shown in figure 5.
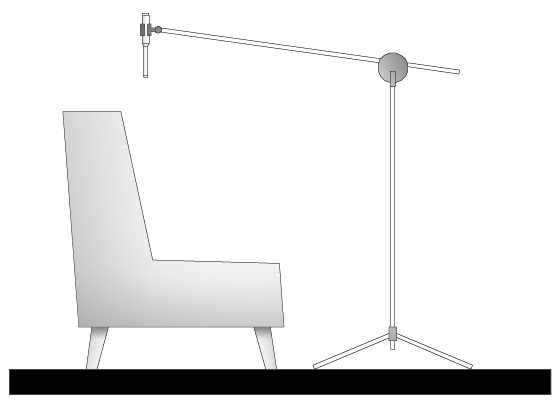
Figure 5. Measurement setup for the mains
Measure the mains both individually and together, then try varying the position and noting the way in which position affects the response. In particular, aim for positions that tend to avoid dips in response. Focus on the response below 300 Hz. In this range, the mains will run as both stereo and dual mono sources – this will vary with recordings. While recording practice varies, for our purposes we will assume that above 100 Hz we are dealing with a stereo source, and mono below.
The main implication is that where the signal is dual mono, the left and right speakers can smooth each other out. We can optimize the response below 100 Hz with measuring both speakers together, but above this point we should treat them as stereo sources.
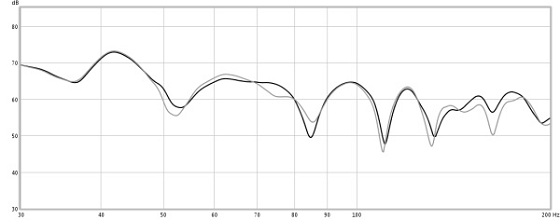
Figure 6. Effect of moving speakers 150 mm
In the above example you can see that moving the mains as little as 150mm makes a difference. Below you can see a range of positions for the left main speaker that represent the maximum range of positions possible in this particular room.
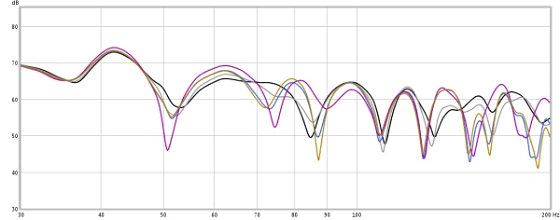
Figure 7. Various positions for the left speaker
Notice that with various placements, some peaks and dips are constant while others shift in frequency. Room modes don’t shift in frequency as the speaker or listening position is varied. The degree to which various modes are excited varies. Where you see a shift in frequency for a peak or dip, a boundary effect may be represented. The frequency shifts due to the distance to the boundary changing. This is best observed with just one speaker.
Just above 40 Hz you can see a persistent peak. That is caused by the primary room depth mode and so it does not shift. Around 85 – 88 Hz the dip is related to the offset from the side and front walls. The shift is caused by boundary interference.
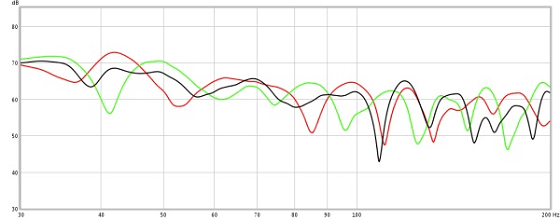
Figure 8. Left speaker (red), right speaker (green), combined (black)
In figure 8 you can see the effect of combining the left and right speaker. Digital delay via DSP was used to time align them because the left speaker was closer. You can see that their response below 100 Hz is considerably smoother with boundary related dips around 80 – 100 Hz eliminated. Above 100 Hz we don’t see any significant improvement.
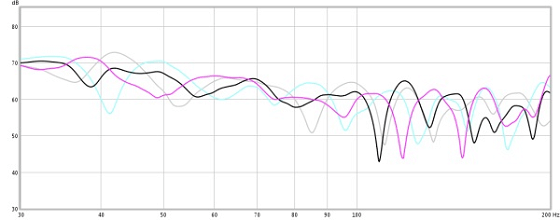
Figure 9. Both speakers combined with time alignment (black) and without (magenta). Individual responses shown in light grey
In Figure 9 we can see that even where time alignment isn’t used, the mains are smoother when combined.
Choose positions for the mains that result in the smoothest possible response when measured together below 100 Hz, and individually above this point.
Measurements for placing your subs
The method shown here allows a large number of measurements to be taken quickly. The sub and mic positions are reversed so that a sub is positioned in the main listening position and elevated to be around ear level. The mic can then be placed in the sub position.
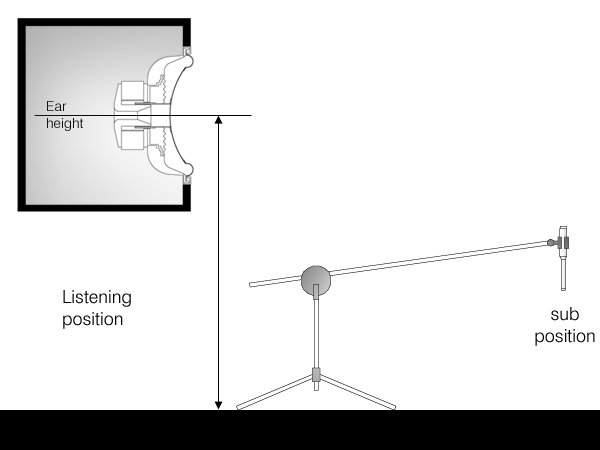
Figure 10. Subwoofer measurement setup
Using this method, run a series of sweeps, moving the mic into all positions that might be useful. If you are considering building your own, you might also get creative and measure unusual locations like the ceiling. Built-in subs allow unusual placements. Sometimes it pays to consider alternatives. These charts provide a survey of your room response. It is a quick way to find the best likely positions.
An overlay of all your measurements can easily look more confusing than this:
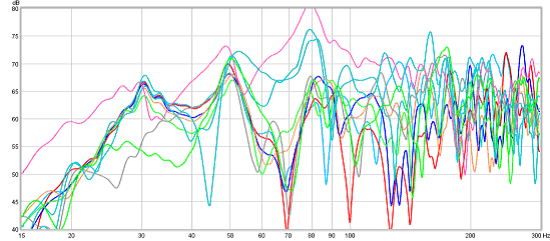
Figure 11. Measurements at various sub positions
You can overlay them all under the “All SPL” tab. Now deselect them all. You can do this by right clicking over the legend area. You can choose which to overlay, making it easier to analyze the results.
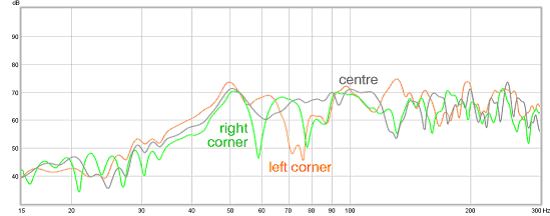
Figure 12. Front corner central sub positions
You can see here that for a single subwoofer, the center position here is best. It is much smoother from 50 – 100 Hz. Left and right corners together perform better than individually, but a single center sub here is equally effective. It’s at this point that you start to realize that your money invested in measurement tools can easily pay for itself. It’s not difficult at all for one sub to do the work of two not optimally placed.
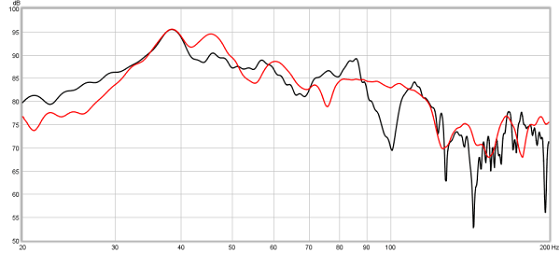
Figure 13. Right corner sub (black), left rear corner (red)
This example shows the sub placed in the right corner (black) and in the left rear corner (red) which is close to the listening position. Both have similar gain and extension, but the red plot shows a smoother response above 90 Hz. Unfortunately the position that measured better (red) was unsuitable due to localization issues. The smoother response around 80 – 120 Hz was of limited value since the chosen crossover point is 80 Hz.
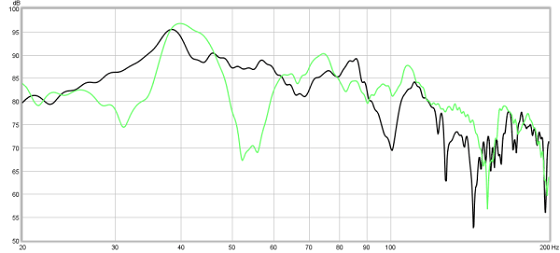
Figure 14. Right corner sub (black) vs alternative position (green)
In this example, an alternative position has a smoother top end but a major dip in the middle of its bandwidth 50 – 60 Hz and another above 30 Hz. The corner placement is clearly better.
Dealing with multiple seats
Perhaps the greatest challenge is a large home cinema room where the response varies greatly from seat to seat. While this is more difficult than a two channel system where just one position is the focus, multiple subs help greatly. In some cases, it might be necessary to assign a higher priority to the prime seating position, or a number of more important seats.
If you are optimizing many seats in multiple rows, then you will need to repeat measurements for different seats. You can reduce the need for large numbers of measurements, by finding the variation from seat to seat, then choosing two or three positions to measure. If you have three rows of four seats, then taking 12 measurements for each tested sub position creates excessive data. It’s more than likely that you could choose one seat in each row, or you may pick two from the first two rows and let the chips fall with the third row.
It is recommended to measure different listening positions as well as speaker and sub positions. This will show that some listening positions are better than others.
How to use the results
The aspect that many find difficult is knowing what to do with the results. The key to being able to use the results is to know what you are looking for. One of the main things we are looking for here is to combine acoustic sources in different locations that, when combined, remove response dips.
Combine two speakers with the same dip and you are stuck with it. Combine two speakers each with a dip in a different place and the other counteracts it. Where all sources are in-phase, they will sum as shown.
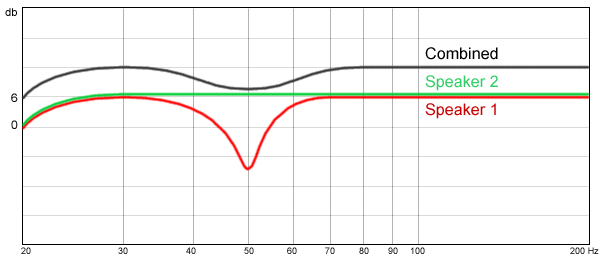
Figure 15. SPL response combination for in-phase speakers
You can see that where both speakers have the same level and are both flat, they gain a 6 dB increase in level combined. When one of them has a dip, the speaker with the dip simply fails to contribute as much, and the result is that the dip tends to be smoothed. In some cases the dip has very little effect. You can use this to your advantage by selecting positions that cancel out the dips.
The measured response of speakers in a room is more complex, so predicting the combined response is not quite so simple as one might expect.
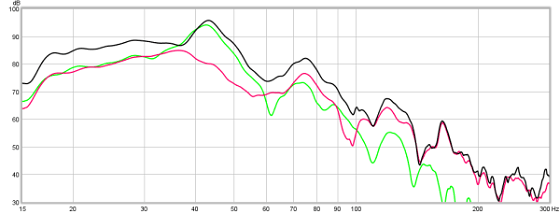
Figure 16. Two subs combined (left = green, right = red, combined = black
For most of the bass range, the two subs gain 6 dB when combined. Around 40 – 60 Hz, one of them has a much higher level due to a room mode peak that other doesn’t excite. As a result, the level is not much more than the left sub alone. Above this point up to 100 Hz, they sum together quite well until at higher frequencies they are again dominated by the sub that is substantially higher in level.
The main priority is to avoid dips. The peaks at this stage are less of a concern as they can often be tamed with EQ later in the process. If dips remain after treatment and the placement of multiple bass sources, then they will most likely remain unfixable.
You may also recall that in part 1, an example was shown of overlapping the response of subs and mains.
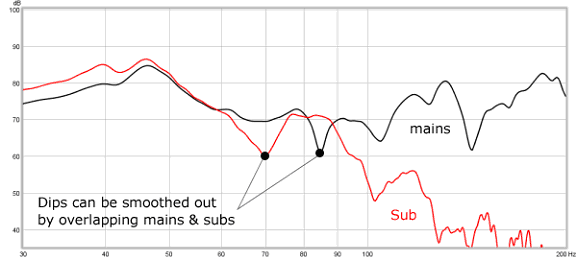
Figure 17. Overlapping mains and subs
With this in mind, you can now look through your measurements and choose locations that you think will work. With just one sub and the measurement setup shown in figure 10, you can determine how many subs you require. It is not a matter of output, but rather how many are required to smooth out the dips.
Choosing positions
Now you can choose where your mains and subs should be placed.
- Consider the extension of your main speakers – how low can they operate while offering acceptable headroom?
- Identify the dips below 100 Hz that remain when both are measured together.
- Overlay the responses of subwoofer positions until you have the minimum number required to smooth out all dips below 100 Hz. Ideally this should be achieved with 1 – 5 subwoofers. Consider also the mains as they may reduce the number of subwoofers required.
- Find the lowest frequency of the mains that is useful in terms of smoothing out the bass. Add a high pass filter at this point.
Measure mains and subs combined
Measuring the mains and subs combined now requires the mic to be placed in the listening position. Your mains will now be in the positions that you determined work well. Now place your first sub in the position that measured best previously. It is generally best that this position is in the front half of the room, especially if you have only one subwoofer. A single subwoofer placed too close to the listening position will often suffer from localization problems. Trying to avoid them will often involve a steeper low pass filter slope set to a lower frequency. This can tend to negate many of the improvements in smoothing out the room response. A single sub will often work best in the middle of the front wall, or in one of the front wall corners.
Now place the second sub in a position that is expected to smooth out dips in the response of the first.
In figure 12, we saw that a single center sub worked quite well and was equal to two corner subs. However, a row back has a different response:
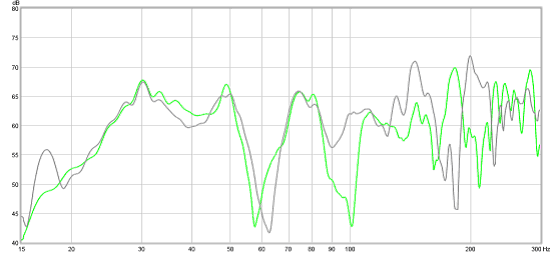
Figure 18. What happens in a second row? (First row response shown in Fig 12)
The dip at 60 Hz is clearly a problem. The solution is to introduce a sub in one of the rear corners.
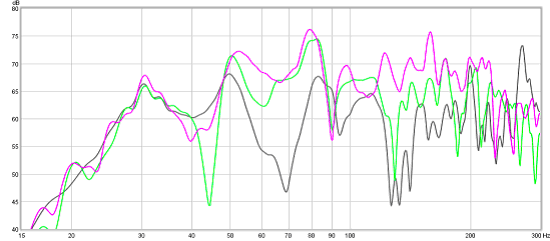
Figure 19. Rear seating row, center front sub (grey), right rear corner (green) and rear left corner (magenta)
It is not difficult to see that a second sub in either of these corners results in a much better response. These measurements were taken in a large home theatre room documented as a case study on my blog:
As you measure mains and subs both individually and combined, you should start to notice that each time another bass source is added, the response gets smoother.
Try different high pass settings on the mains. The goal is to let them run as low as needed to smooth out the bass response of the subs, but no lower. If they aren’t helping in this regard, then the high pass can be set higher.
How many measurements do you need?
One could easily take hundreds of measurement sweeps in this process. For example, one could measure 8 seating positions, each adjusting the position 4 times. This means 32 measurements for each speaker position. One can also measure all the speakers in various positions, individually and combined, and with various settings. It quickly becomes tedious. Rather than do this, you may start with the mains only and measure all listening positions. This provides an indication of the seat to seat variation. You might then pick a couple of positions to represent all of them, or you may pick just one to focus on and confirm later that the other positions work well enough. Approaching measurements in this way will get you to a result quicker without getting lost in too much data.
Are high pass filters required?
A high pass filter, otherwise known of as a “rumble filter” is one that filters frequencies below a certain point. If vented speakers are used, a rumble filter is essential because below port tuning, the box provides no damping of driver excursion. Other types of speakers also benefit because the headroom is increased. In home theatre systems it is typical for mains to have a high pass at 80 Hz when the speakers are set to “small.” This gives the system greater output and headroom, however, in following this guide one may choose to run the mains lower. As a result, including a high pass filter on the mains is even more important than usual and one might choose a steeper slope to compensate for the added low frequency demands. It’s also generally a good idea to use a high pass filter on the subs as well.
This is covered further on my blog:
Why you need a rumble filter >
Step 5: Apply EQ and complete the integration
This step is often inserted by many as an alternative to all of the other strategies undertaken. At this point, if you have worked through all the steps, the inadequacy of EQ in isolation will now be evident, especially in a large home theatre room. When everything else has been done, EQ is used to tame any peaks that persist and shape the response into a desirable room curve.
In a large cinema room with substantial variation across multiple rows and seats, EQ alone is only moderately effective. Multiple bass sources are needed to smooth out the response and room treatments are essential to damp modal ringing.
Once that is done, optimising a single seat with EQ is a simple exercise. With multiple subwoofers properly placed, multiple seats can also be optimized. It is a matter of using EQ that applies to all seats. Peaks that result from room modes will be the focus.
- Overlay the response of all speakers and subs and look for persistent peaks that occur in all positions below 100 Hz.
- Look at the response of speakers individually from 100 – 200 Hz. EQ may not be practical in this region.
At this point you may need to consider the priority assigned to different seats.
Using REW to simulate EQ filters
REW has a very useful EQ tool to choose filter settings.
- Click on the Overlays icon in REW:

- Set graph limits with sensible settings, limiting the x range to 200 Hz and excluding empty data. If bass extends to 30 Hz, there is no point showing all the way down to 2 Hz. Likewise, set y-axis limits so the response falls within the window without appearing artificially flattened by a large range.
- Click on the EQ icon in REW:

- 4. In the right menu, select the EQ device. (Figure 20)
- Return to the overlays window, then select the “Predicted SPL” tab.
- In the legend area showing all the plots, right-click and select “clear selections.”
- Now select the plot that you want to EQ. With this in the background return to the EQ window and select EQ filters.
- Choose a peak to target, then set the frequency, attenuation and filter width (Q) until it is removed.
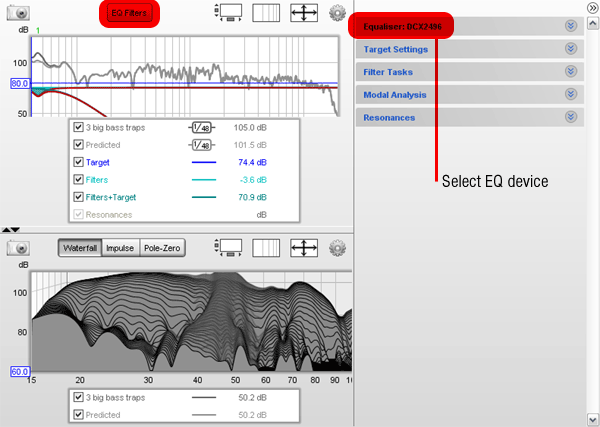
Figure 20. The EQ dialogue box in Room EQ Wizard
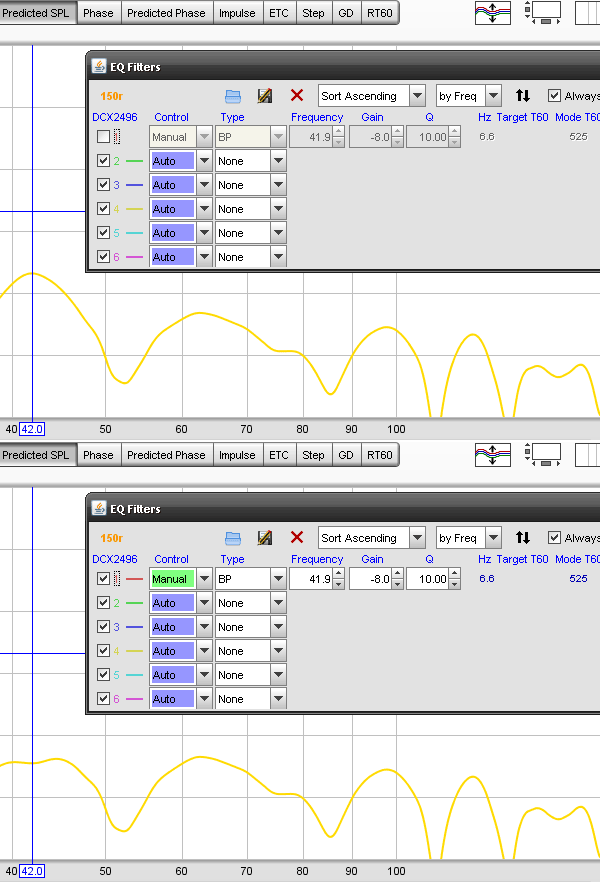
Figure 21. Simulating an EQ filter in Room EQ Wizard
You can then confirm the result by measuring in various seats.
Applying a target curve
Once you have a smooth response you can then apply a room target curve to you’re your taste and source material. Recall the chart shown in Part 1:
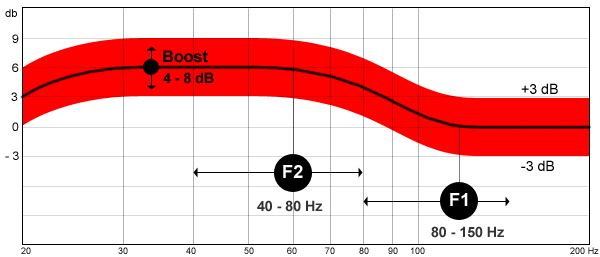
Figure 22. The room target curve
It is best to separate the EQ filters for taming modes from those used for creating the target curve. This allows the boost level to be altered as required quickly, as you would with tone controls. There is no single curve that will suit all music and movies. The lack of standards in music production is the cause.
You can determine the filters required using the REW EQ filters tool as shown previously. Since there are so many different ways to apply this target curve, detailed instructions are beyond the scope of this guide. In a two channel system, shelving filters may be added to the inputs. In an AV system it may be a simple matter of adjusting the subwoofer levels. In some cases it may be necessary to use a combination of both. Once the process and filters available are understood, it is not difficult to apply a target curve. It’s likely that you will need to adjust it and ideally have the ability to tweak the bass to suit different music at times. You may also find that you prefer running the bass more than 8 dB louder than the mains.
Exceptional bass
If you have worked through all the steps without compromise, at this point you should have a very good result. All your favourite bass tracks are likely to come out as you rediscover bass that is tight and controlled and maintains a balance that sounds right to you. It is neither bloated nor lacking. The only problem now is that different albums mix the bass at wildly different levels.
Looking over your response plots, you should see a smooth response in your main listening position, and any other seats you have optimised. Your decay plots should show an even decay free from modal ringing. By now you will have begun to appreciate the connection between what you see in measurements and what you hear subjectively.
Further steps
You have now undertaken the main steps involved in bass integration. There are two remaining areas that deserve further investigation. The first is phase alignment using digital delay to the mains. This can be done with low-cost entry-level DSP devices such as the Behringer Ultradrive DCX2496 and miniDSP. This may be the subject of a future article. The second area for further investigation is the use of advanced DSP filtering to provide room correction. Of particular interest is DEQX group delay correction. One particular demo provided an indication that this feature can result in substantially tighter bass without a change in frequency response.


Hi Paul, can you explain please why your room target curve has a raised shelf in the low bass region?
Are there references or research that supports this curve?
Thanks for the great articles.
Thank you Paul, great stuff!
Thank you very much indeed Paul, I particularly like your explanations pertaining to interpreting graphs in REW. I really like REW and am thinking of getting the MiniDSP 2x4HD. I wish it were available in a balanced XLR version. Any further advice or developments in your experience since you wrote this excellent 3 part article ?